FinancialTOHO HOLDINGS CO.
Financial Results for the First Half of Fiscal Year Ending March 2017: Toho Holdings
15 pages~24 min full read
Key insights
7 takeaways · ~3 min read- 01
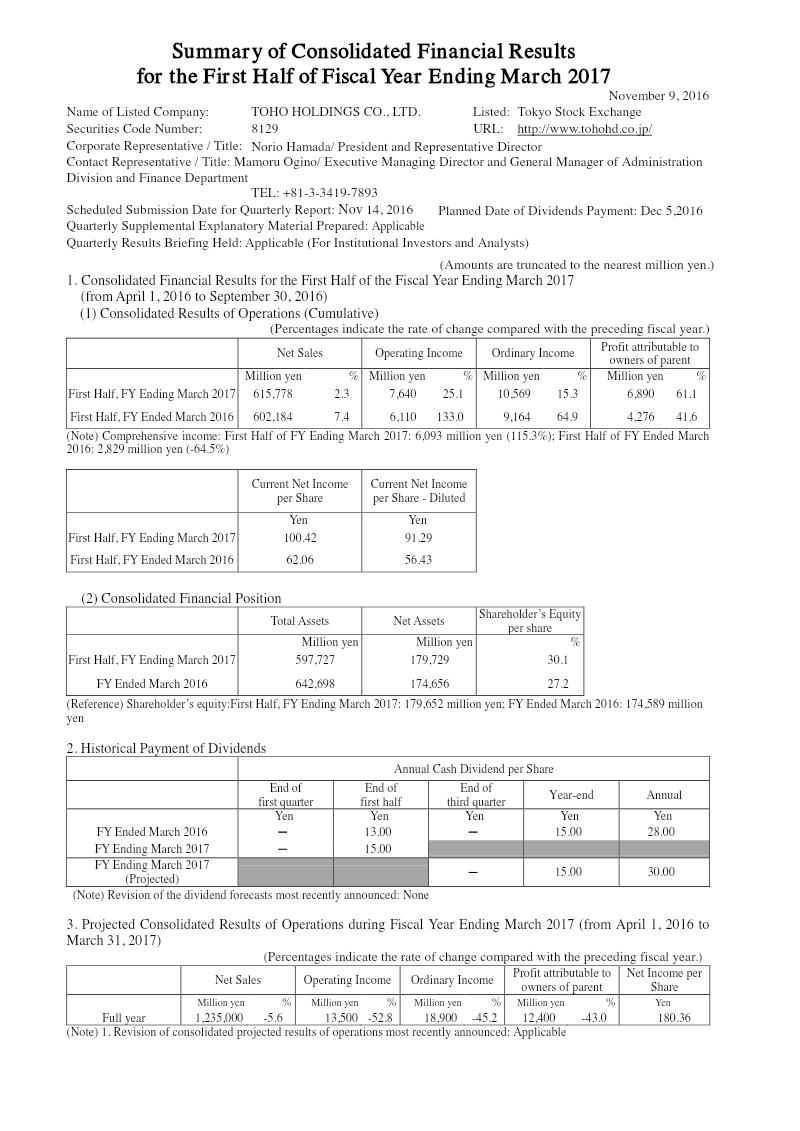
Toho Holdings reported a 61.1% surge in profit attributable to owners of the parent to 6,890 million yen for the first half of the fiscal year ending March 2017.
See it on page 1 - 02
Operating income grew by 25.1% to 7,640 million yen, while net sales increased by 2.3% to 615,778 million yen compared to the same period in the previous year.
See it on page 1 - 03
The pharmaceutical wholesaling segment drove growth with 591,687 million yen in sales and a 49.0% increase in segment income, fueled by strong demand for cancer and hepatitis C treatments.
See it on page 4 - 04
The dispensing pharmacy business experienced a significant 79.7% decline in segment income, attributed to medical service fee revisions and productivity challenges.
See it on page 4 - 05
Cash flow from operating activities reached an inflow of 17,233 million yen, marking a recovery from the previous year, while the shareholder equity ratio stood at 30.1%.
See it on page 5 - 06
The company transitioned its depreciation method for structures and facilities from the declining-balance method to the straight-line method to align with 2016 tax reforms.
See it on page 6 - 07
Full-year earnings forecasts were revised to account for performance trends observed during the first half of the fiscal year ending September 30, 2016.
See it on page 5