FinancialToho Holdings Co., Ltd.
Quarterly Financial Results: First Half of Fiscal Year Ending March 2016
14 pages~25 min full read
Key insights
7 takeaways · ~3 min read- 01
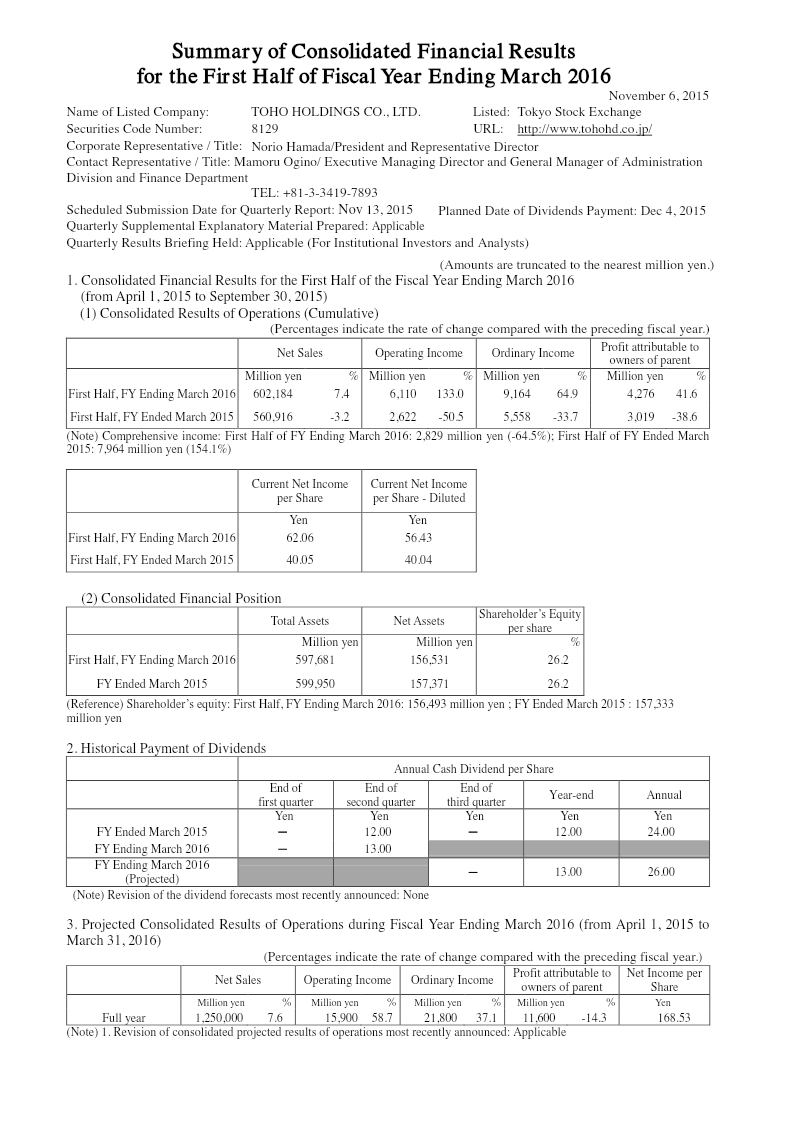
TOHO HOLDINGS reported strong growth for the first half of fiscal year 2016 (April–September 2015), with net sales reaching 602,184 million yen, a 7.4% year-on-year increase.
See it on page 1 - 02
Operating income surged by 133.0% to 6,110 million yen, while profit attributable to owners of the parent grew by 41.6% to 4,276 million yen.
See it on page 1 - 03
The pharmaceutical wholesaling business drove overall performance with 577,053 million yen in net sales and a 100.4% increase in segment profitability.
See it on page 4 - 04
The dispensing pharmacy business achieved 47,630 million yen in net sales and a significant 1,187.4% increase in segment income, totaling 931 million yen.
See it on page 4 - 05
Growth was supported by the implementation of proprietary customer support systems, including the Dispensing ENI-Pharma series and ENIFvoiceSP, despite market pressure to reduce medical expenses.
See it on page 4 - 06
As of September 30, 2015, the company maintained a stable financial position with total assets of 597,681 million yen and total net assets of 156,531 million yen.
See it on page 7 - 07
Management revised full-year earnings projections upward following the performance trends observed in the first half of the fiscal year.
See it on page 3