Related Documents
Financial
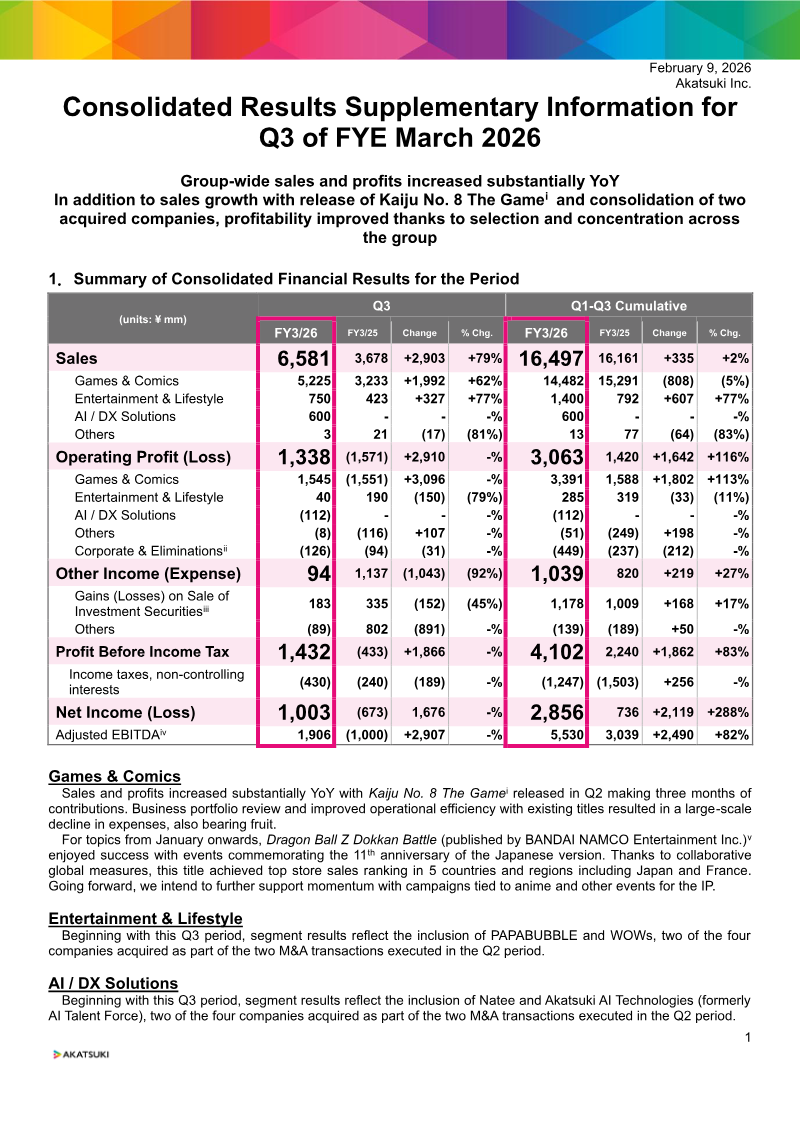
Consolidated Results Supplementary Information for Q3 of FYE March 2026
Akatsuki Inc. reported substantial year-over-year growth in sales and profitability for the third quarter of the fiscal year ending March 2026. Consolidated sales for the quarter reached ¥6,581 million, a 79% increase compared to the same period in the previous year, while operating profit rose to ¥1,338 million, reversing a loss from the prior year. This financial improvement was driven by the successful release of Kaiju No. 8 The Game, the continued performance of Dragon Ball Z Dokkan Battle, and the strategic consolidation of four acquired companies. The Games & Comics segment remains the primary revenue driver, contributing ¥5,225 million in quarterly sales. Profitability in this sector improved significantly due to a rigorous business portfolio review and enhanced operational efficiency for existing titles, which led to a large-scale reduction in expenses. Beyond gaming, the company expanded its scope through M&A activity, establishing a new AI / DX Solutions segment and bolstering the Entertainment & Lifestyle division. These new segments reflect the inclusion of acquired entities such as PAPABUBBLE, WOWs, Natee, and Akatsuki AI Technologies. Geographically, the company noted strong global performance for its legacy titles, specifically reaching top store rankings in five regions, including Japan and France. Financial data indicates a robust balance sheet with cash and equivalents totaling ¥33,266 million. The methodology for these results involves consolidated accounting of various subsidiaries and the use of Adjusted EBITDA to measure performance, which accounts for depreciation, amortization, and investment-related cash flows. Overall, the findings suggest a successful transition toward a more diversified and cost-efficient corporate structure.
AkatsukiFeb 2026
Financial
Consolidated Financial Results: FY3/26 Q2
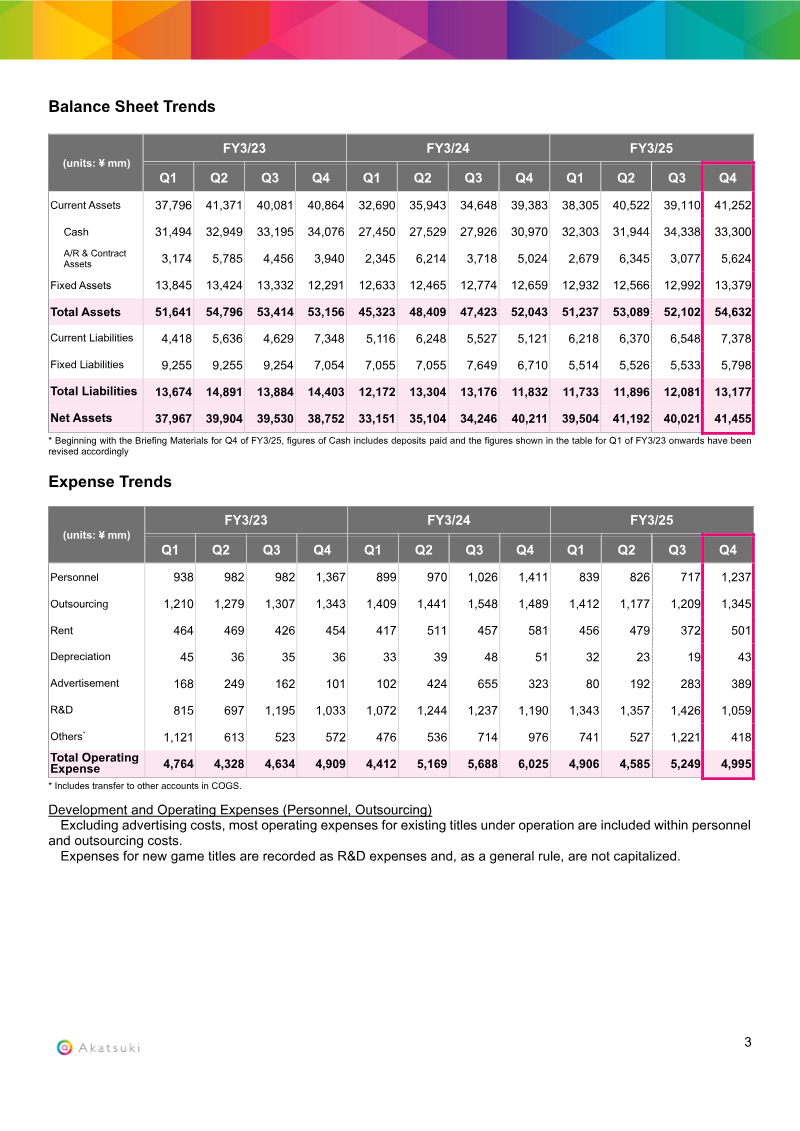
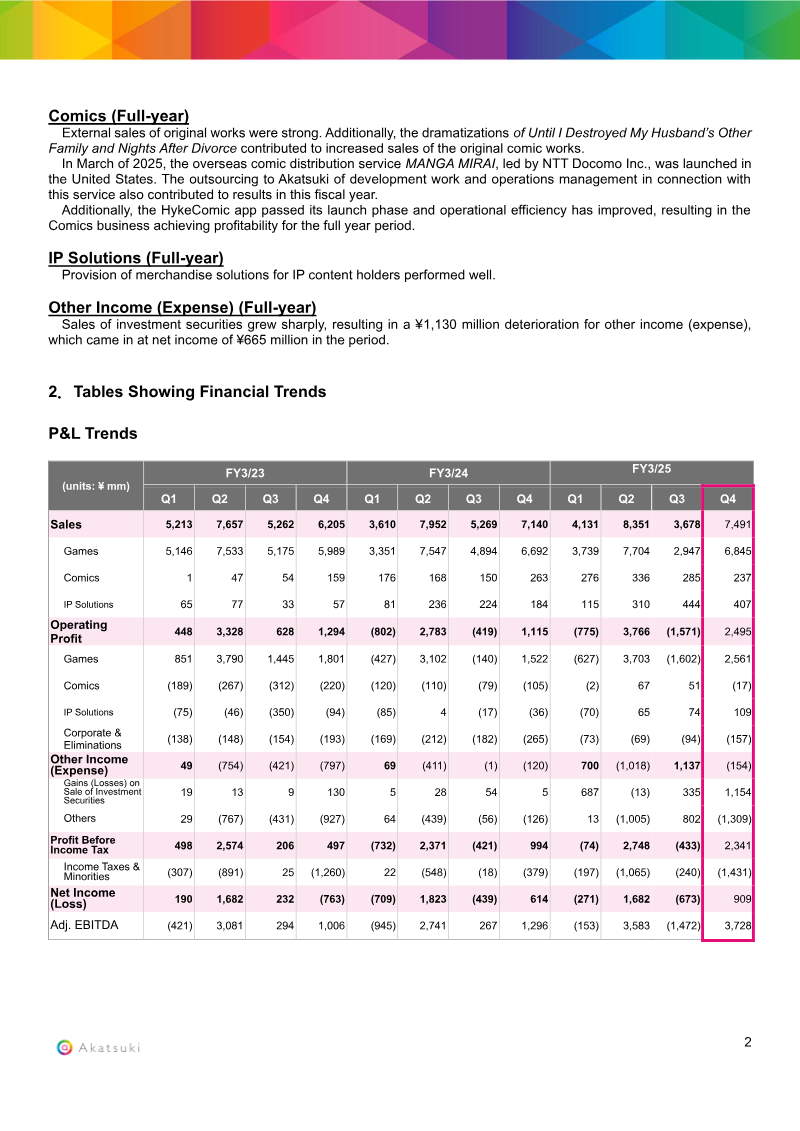
Akatsuki Inc. achieved consolidated sales of ¥7,602 million and a net income of ¥3,020 million during the second quarter of the fiscal year ending March 2026, representing an 80% year-over-year increase in profitability. This financial performance was primarily bolstered by strategic investment exits and the successful launch of Kaiju No. 8 The Game, which secured over 5 million downloads and generated more than ¥2 billion in its debut month. While the core Games & Comics segment experienced a 10% decline in sales compared to the previous year’s high benchmarks, the company maintained strong operational momentum through established titles like Dragon Ball Z Dokkan Battle and a significant 40% overseas sales ratio for new releases. The strategic focus has shifted toward a reorganized three-segment business model designed to diversify revenue streams beyond traditional mobile gaming. This evolution includes the expansion of the Entertainment & Lifestyle pillar, highlighted by the acquisition of the candy brand PAPABUBBLE, and the establishment of an AI/DX Solutions division. Total assets rose to ¥59.4 billion as a result of aggressive M&A activity, which added substantial goodwill and software assets to the balance sheet despite a corresponding decrease in cash equivalents used for these acquisitions. Human capital remains a priority, with permanent staff increasing to 561 to support new business ventures, even as the core gaming division saw a slight contraction in headcount. The company is positioning itself for long-term growth by leveraging investment exit gains, which totaled approximately ¥400 million in the second quarter, to fund its transition into a broader entertainment conglomerate. These structural changes and recent product successes suggest a pivot toward a more diversified portfolio intended to mitigate the volatility of the gaming market while capitalizing on global intellectual property.
AkatsukiNov 2025
Financial
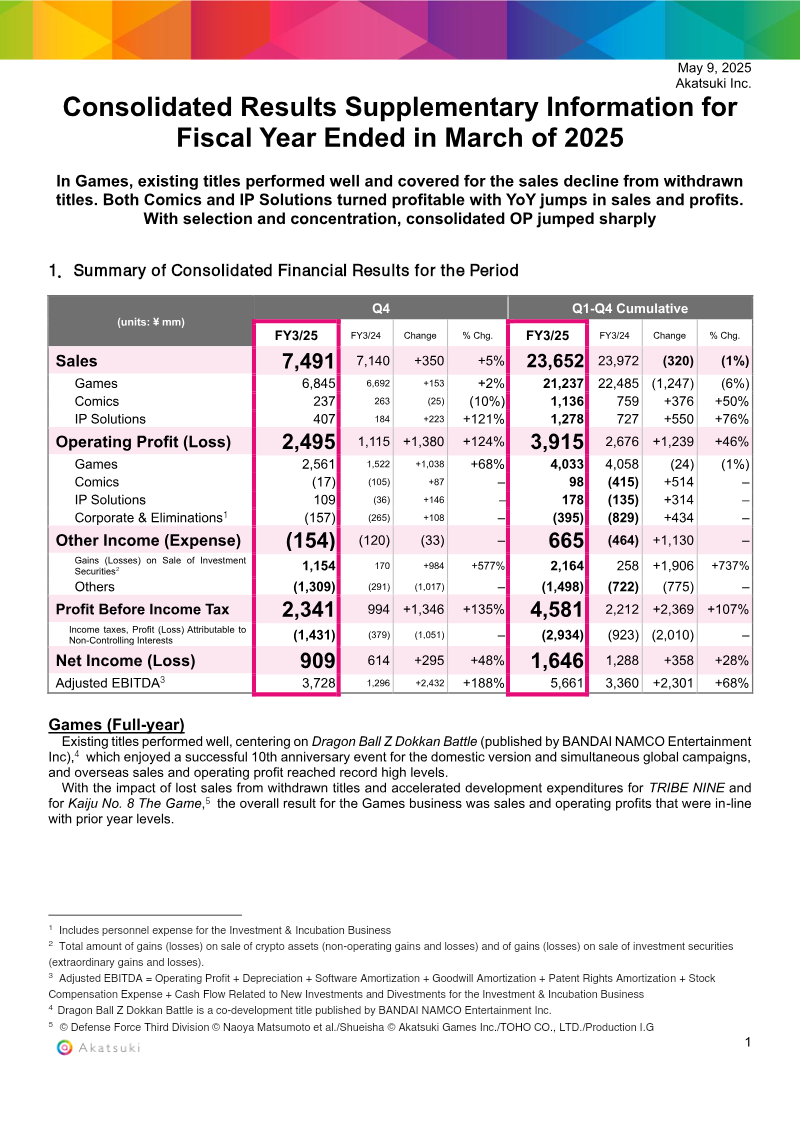
Consolidated Results Supplementary Information for Fiscal Year Ended in March of 2025
Akatsuki Inc. reported its consolidated financial results for the fiscal year ended March 2025, highlighting a period of strategic "selection and concentration" that led to a significant increase in profitability. While total annual sales remained relatively flat at ¥23.65 billion, a 1% decrease year-over-year, consolidated operating profit jumped 46% to ¥3.91 billion. This growth was driven by the stabilization of the core Games segment and the successful transition of the Comics and IP Solutions divisions into profitable entities. The Games segment, which accounts for the vast majority of revenue, generated ¥21.24 billion in sales. Performance was bolstered by the 10th anniversary of Dragon Ball Z Dokkan Battle, which achieved record-high overseas sales and operating profit. These gains effectively offset revenue losses from withdrawn titles and increased research and development spending for upcoming projects like TRIBE NINE and Kaiju No. 8 The Game. Meanwhile, the Comics segment saw a 50% surge in annual sales to ¥1.14 billion, achieving full-year profitability due to strong external sales of original works, successful media dramatizations, and a strategic partnership with NTT Docomo for the MANGA MIRAI service in the United States. Geographically, the results reflect a strong emphasis on global expansion, particularly through simultaneous worldwide game campaigns and international comic distribution. Financial data indicates a robust balance sheet with ¥33.3 billion in cash and total assets of ¥54.6 billion. The company also benefited from a substantial increase in gains from the sale of investment securities, which rose over 700% to ¥2.16 billion. Overall, the fiscal year concluded with a net income of ¥1.65 billion, representing a 28% increase over the previous year, supported by improved operational efficiency across all business pillars.
AkatsukiMay 2025
Financial
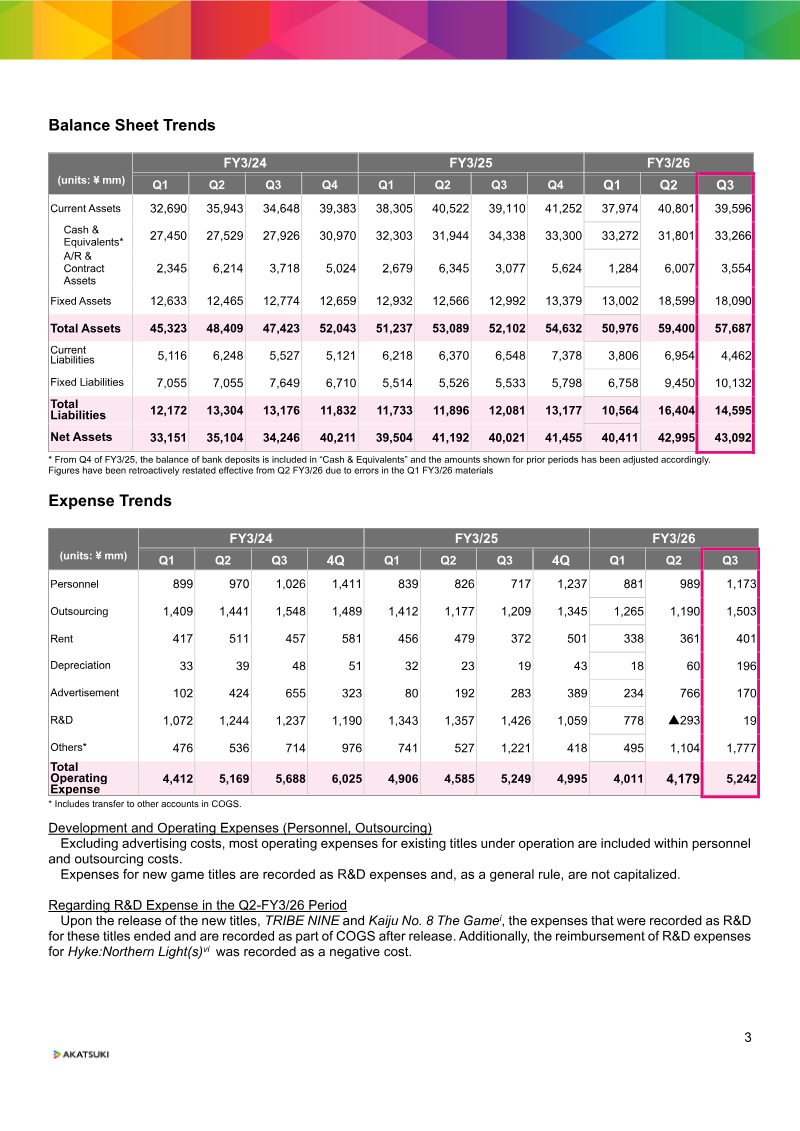
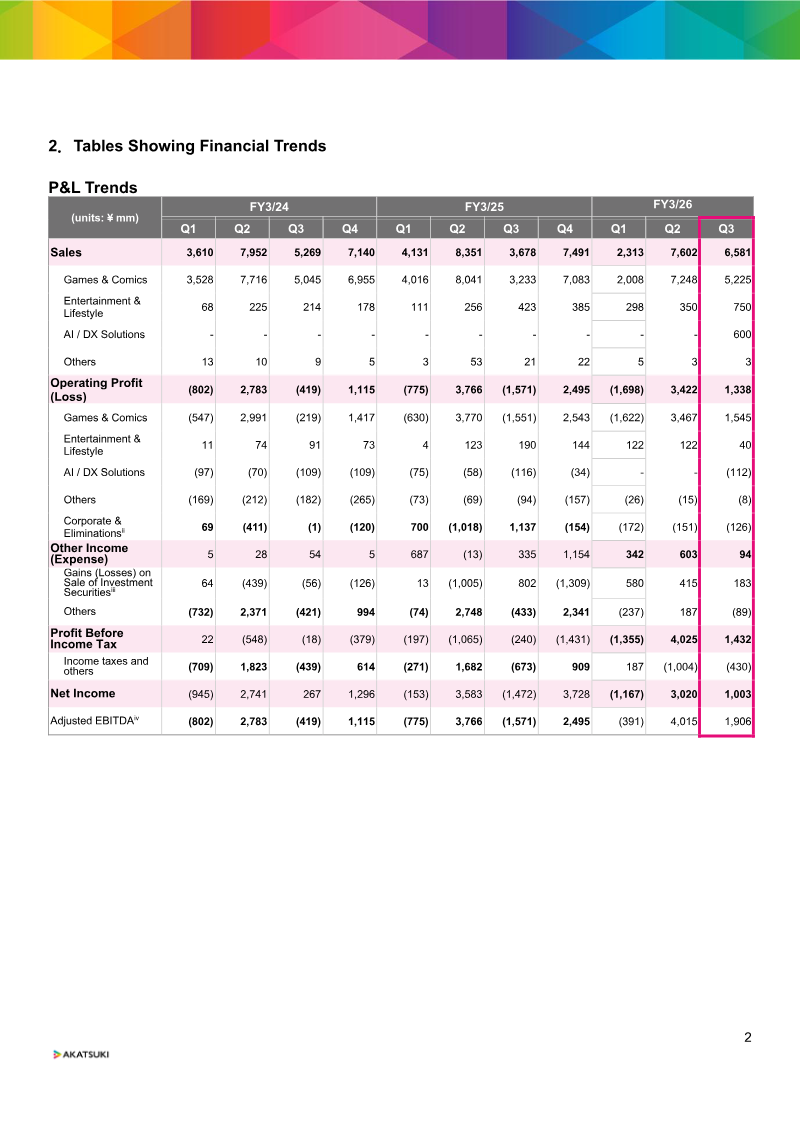
Consolidated Financial Results: FY3/26 – 3rd Quarter
Akatsuki Inc. achieved a significant financial turnaround in the third quarter of the fiscal year ending March 2026, characterized by a 79% year-over-year increase in consolidated sales to ¥6,581 million and a return to profitability with net income reaching ¥1,003 million. This performance was underpinned by a strategic reorganization into three core segments: Games & Comics, Entertainment & Lifestyle, and AI/DX Solutions. Growth was primarily catalyzed by the successful launch of Kaiju No. 8 The Game and the sustained operational efficiency of legacy titles such as Dragon Ball Z Dokkan Battle, which continues to drive revenue despite inherent seasonal fluctuations tied to major anniversary events. The company’s operational structure has shifted toward a model of selection and concentration, marked by strategic M&A activity and a reduction in research and development spending as major projects moved into the operational phase. While personnel and outsourcing costs rose due to the integration of new subsidiaries like PAPABUBBLE and Akatsuki AI Technologies, the core gaming workforce saw a downward trend in permanent staff. Investment activities remain a vital component of the corporate value proposition, with ¥2.2 billion in proceeds realized from exits, including one IPO and two M&A transactions, during the cumulative nine-month period. Future strategy focuses on global IP expansion and optimized capital allocation, supported by a strategic alliance and a commitment to shareholder returns. The company has established a plan to return between ¥10 billion and ¥15 billion to shareholders through fiscal year 2028, utilizing a progressive dividend policy. Despite a slight decrease in total assets to ¥57,687 million due to lower accounts receivable, the group maintains a robust financial position intended to support long-term growth across its diversified entertainment and technology portfolio.
AkatsukiFeb 2026