Updated Mar 23, 2026 by Bristol-Myers Squibb
What can I help with?
AI-powered answers with citations from the library.
What can I help with?
AI-powered answers with citations from the library.
Report
Published by Bristol-Myers Squibb
Bristol-Myers Squibb’s first-quarter 2025 results demonstrate a strategic transition toward its growth portfolio, which achieved a 16% year-over-year increase in net sales. While total global net sales reached $11.2 billion, representing a 6% decline compared to the previous year, the company’s performance was bolstered by strong demand for key assets such as Opdivo, Breyanzi, and Camzyos. The company continues to navigate the impact of generic competition on legacy products, including Revlimid, Sprycel, and Pomalyst, while simultaneously advancing a robust pipeline of clinical and regulatory milestones. Financial execution remains disciplined, with the company raising its full-year 2025 guidance for both total revenues and non-GAAP earnings per share. The updated revenue outlook of $45.8 billion to $46.8 billion reflects favorable foreign exchange impacts and stronger-than-anticipated performance in the legacy portfolio. Non-GAAP diluted earnings per share are now projected in the range of $6.70 to $7.00. The company maintains a focus on capital allocation, prioritizing debt reduction—having achieved approximately $6 billion in paydowns toward a $10 billion target—while sustaining its commitment to shareholder dividends and share repurchases. Operational highlights for the quarter include the successful U.S. launch of Opdivo Qvantig and continued volume growth for established oncology and immunology treatments. The company is entering a data-rich period through 2027, with multiple pivotal data readouts expected for new molecular entities and life-cycle management programs. By leveraging improved market access and maintaining a strong balance sheet, the organization aims to sustain its long-term growth trajectory despite ongoing macroeconomic and regulatory challenges.
Forward Looking Statements and Non-GAAP Financial Information This presentation contains statements about Bristol-Myers Squibb Company’s (the “Company”) future financial results, plans, business development strategy, anticipated clinical trials, results and regulatory approvals that constitute forward-looking statements for purposes of the safe harbor provisions under the Private Securities Litigation Reform Act of 1995. All statements that are not statements of historical facts are, or may be deemed to be, forward-looking statements. Actual results may differ materially from those expressed in, or implied by, these statements as a result of various factors, including, but not limited to: (i) new laws, government actions and regulations, including with respect to pricing controls and market access and the imposition of new tariffs, trade restrictions and export regulations, (ii) our ability to obtain, protect and maintain market exclusivity rights and enforce patents and other intellectual property rights, (iii) our ability to achieve expected clinical, regulatory and contractual milestones on expected timelines or at all, (iv) difficulties or delays in the development and commercialization of new products, (v) difficulties or delays in our clinical trials and the manufacturing, distribution and sale of our products, (vi) adverse outcomes in legal or regulatory proceedings, (vii) risks relating to acquisitions, divestitures, alliances, joint ventures and other portfolio actions and (viii) political and financial instability, including changes in general economic conditions.
istribution and sale of our products, (vi) adverse outcomes in legal or regulatory proceedings, (vii) risks relating to acquisitions, divestitures, alliances, joint ventures and other portfolio actions and (viii) political and financial instability, including changes in general economic conditions. These and other important factors are discussed in the Company’s most recent annual report on Form 10-K and reports on Forms 10-Q and 8-K. These documents are available on the U.S. Securities and Exchange Commission’s website, on the Company’s website or from Bristol- Myers Squibb Investor Relations. No forward-looking statements can be guaranteed. In addition, any forward-looking statements and clinical data included herein are presented only as of the date hereof. Except as otherwise required by applicable law, the Company undertakes no obligation to publicly update any of the provided information, whether as a result of new information, future events, changed circumstances or otherwise. This presentation includes certain non-generally accepted accounting principles (“GAAP”) financial measures that we use to describe the Company’s performance.
publicly update any of the provided information, whether as a result of new information, future events, changed circumstances or otherwise. This presentation includes certain non-generally accepted accounting principles (“GAAP”) financial measures that we use to describe the Company’s performance. The non-GAAP financial measures are provided as supplemental information and are presented because management has evaluated the Company’s financial results both including and excluding the adjusted items or the effects of foreign currency translation, as applicable, and believes that the non-GAAP financial measures presented portray the results of the Company’s baseline performance, supplement or enhance management’s, analysts’ and investors’ overall understanding of the Company’s underlying financial performance and trends and facilitate comparisons among current, past and future periods. This presentation also provides certain revenues and expenses excluding the impact of foreign exchange (“Ex- FX”). We calculate foreign exchange impacts by converting our current-period local currency financial results using the prior period average currency rates and comparing these adjusted amounts to our current-period results. Ex-FX financial measures are not accounted for according to GAAP because they remove the effects of currency movements from GAAP results. The non-GAAP information presented herein provides investors with additional useful information but should not be considered in isolation or as substitutes for the related GAAP measures.
are not accounted for according to GAAP because they remove the effects of currency movements from GAAP results. The non-GAAP information presented herein provides investors with additional useful information but should not be considered in isolation or as substitutes for the related GAAP measures. Moreover, other companies may define non-GAAP measures differently, which limits the usefulness of these measures for comparisons with such other companies. We encourage investors to review our financial statements and publicly filed reports in their entirety and not to rely on any single financial measure. An explanation of these non-GAAP financial measures and a reconciliation to the most directly comparable financial measure are available on our website at www.bms.com/investors. Also note that a reconciliation of forward-looking non-GAAP measures, including non-GAAP earnings per share (EPS), to the most directly comparable GAAP measures is not provided because comparable GAAP measures for such measures are not reasonably accessible or reliable due to the inherent difficulty in forecasting and quantifying measures that would be necessary for such reconciliation. Namely, we are not, without unreasonable effort, able to reliably predict the impact of accelerated depreciation and impairment charges, legal and other settlements, gains and losses from equity investments and other adjustments. In addition, the Company believes such a reconciliation would imply a degree of precision and certainty that could be confusing to investors.
t the impact of accelerated depreciation and impairment charges, legal and other settlements, gains and losses from equity investments and other adjustments. In addition, the Company believes such a reconciliation would imply a degree of precision and certainty that could be confusing to investors. These items are uncertain, depend on various factors and may have a material impact on our future GAAP results. Certain information presented in the accompanying presentation may not add due to the use of rounded numbers. crie aajasccd Tccl
Q1 2025 Performance Commercial Execution R&D Milestones Global Net Sales: Q1:~$11.2B (6%) YoY; (4%) Ex-FX* Achieved multiple clinical & regulatory milestones<sup>1</sup> Growth Portfolio Net Sales +16%; +18% Ex-FX* OPDIVO Breyanzi $ in billions (nivolumab) (lisocabtagene maraleucel)SUSPENSION FOR IV INFUSION INJECTION FOR INTRAVENOUS USE 10 mg/mL 4.8 5.6 CAMZYOS milvexian<sup>2</sup> (mavacamten) 2.5, 5,10,15mg capsules Q1 2024 Q1 2025 Financial Execution 2025 Guidance3,4 Earnings Per Share (EPS): Raised Total Revenues ~45.8B - 46.8B<sup>5</sup> GAAP: 1.20 & Non-GAAP* 1.80 (Reported Rates & Ex-FX*) 6.70 - 7.00 Raised Non-GAAP EPS* *See “Forward-Looking Statements and Non-GAAP Financial Information” 1. Not an exhaustive list of assets, programs or indications; 2. Enrollment complete (March 2025); 2027 data readout remains on track 3. 2025 Guidance excludes the impact of any potential future strategic acquisitions, divestitures, specified items that have not yet been identified and quantified, and the impact of future Acquired IPRD charges and licensing income; 4. April 2025 guidance was calculated using foreign exchange rates as of April 23, 2025; 5. Range includes ~500M FX favorability (~250M Legacy Portfolio & ~$250M Growth Portfolio)
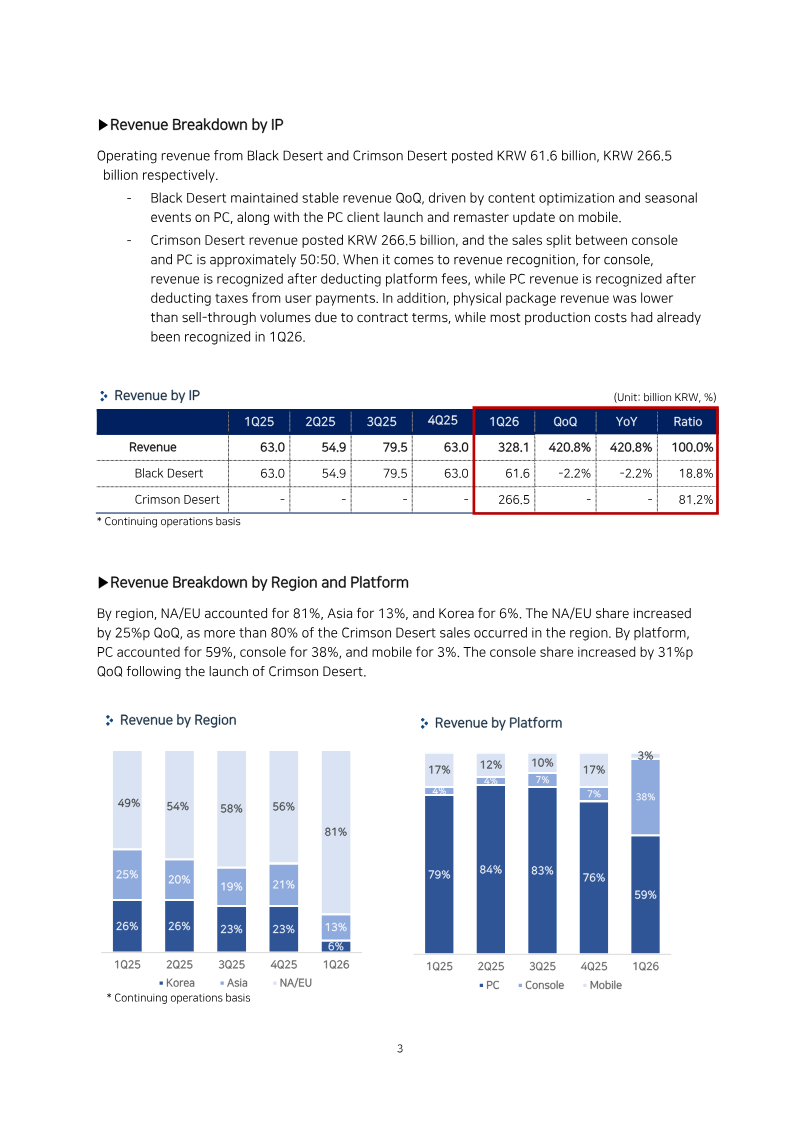
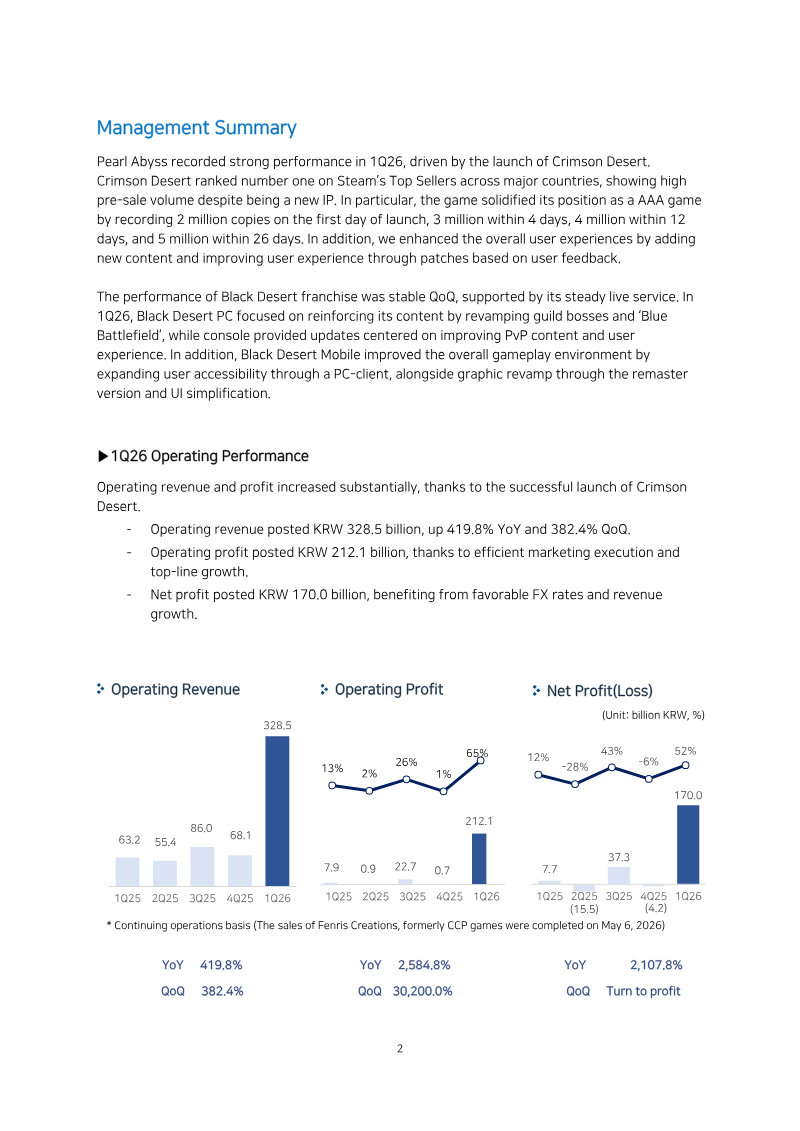
Pearl Abyss achieved a record‑breaking first quarter of 2026, driven primarily by the launch of Crimson Desert. Operating revenue surged to KRW 328.5 billion, a 419.8 % year‑over‑year increase and 382.4 % quarter‑on‑quarter rise, while operating profit climbed to KRW 212.1 billion and net profit reached KRW 170.0 billion, supported by favorable foreign‑exchange gains and efficient marketing spend. Crimson Desert dominated sales, generating KRW 266.5 billion and accounting for 81 % of total revenue, with a balanced split between PC and console. The title achieved rapid early‑stage sales milestones—2 million copies on day one, 5 million within 26 days—and maintained strong momentum through continuous content updates. Black Desert contributed KRW 61.6 billion, maintaining stable quarterly performance through content optimization and seasonal events across PC, console, and mobile platforms. Operating expenses rose 72.7 % QoQ to KRW 116.4 billion, largely due to increased commissions (193.1 % QoQ) and advertising spend (151.6 % QoQ) linked to Crimson Desert’s launch, while labor costs increased 28.9 % QoQ because of temporary hires for the new IP. The company projects 2026 operating revenue between KRW 879.0–975.4 billion, with operating profit expected to reach KRW 487.6–572.6 billion and margin improving to 55.5–58.7 %. Planned releases include DokeV (pre‑production) and Plan 8 (conceptualization), aiming to sustain a new title every 2–3 years. A subsidiary sale of Fenris Creations to its management was completed in May 2026, with future collaboration opportunities retained.
Capcom achieved a historic peak in FY26/3, reporting net sales of ¥1.95 billion and operating profit of ¥752 million—both up 15% year‑over‑year. The surge was driven by strong new‑title releases and catalog sales, particularly through digital channels, and marked the company’s highest cumulative unit sales at 5.9 million. Retail expansion reached 61 stores, including the first overseas Capcom Store in Taipei, underscoring a growing global footprint. Looking ahead to FY27/3, Capcom targets more than 10% operating‑profit growth and ¥2.1 billion in sales, underpinned by a steady pipeline of new IP launches such as *Pragma* and an expanded catalog strategy. The company plans to release one new machine per quarter, aiming for 53 000 units across four titles—including Biohazard RE:3 and Resident Evil 7—while projecting net sales of ¥209 million and operating profit of ¥104 million. A key focus is deepening IP monetisation through e‑sports, media tie‑ins, and mobile extensions, with an expected 18% year‑over‑year increase in pachislo volume and intensified expansion into emerging markets. The FY26/3 earnings report also highlights significant workforce growth, with an annual addition of over 100 developers and the integration of AI tools to enhance efficiency. Financially, net sales rose 14% YoY to ¥1,259 bn and operating profit increased 18% to ¥508 bn, while maintaining a strong cash position that balances shareholder returns, employee compensation, and reinvestment. Diversity metrics improved, with female core‑role representation at 15.7% and paternity leave utilization at 79.7%, reflecting a broader talent strategy aimed at sustaining long‑term innovation and market leadership.
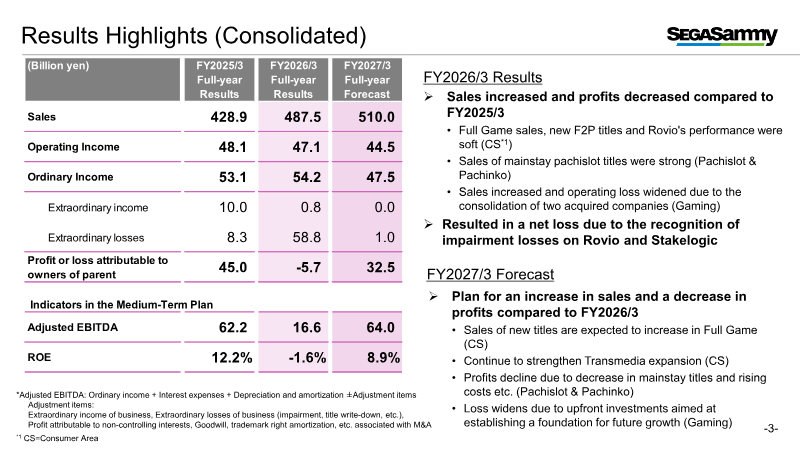
Fiscal year 2026 ended with a 13 % rise in sales to ¥487.5 bn, yet operating income swung from a ¥48.1 bn profit in FY2025 to a ¥5.7 bn loss, driven by significant goodwill impairments on Rovio and Stakelogic and a widening deficit in the Gaming segment. Adjusted EBITDA fell to ¥16.6 bn, reflecting heavy upfront development costs and impairment charges, while net equity contracted by ¥48.7 bn as cash balances were depleted following the acquisitions of GAN and Stakelogic. Within Entertainment Contents, sales edged up to ¥326.6 bn from ¥321.5 bn, but operating income declined from ¥40.8 bn to ¥32.4 bn because new Full‑Game and F2P titles underperformed, despite steady growth in licensing revenue. Forecasts for FY2027 project sales of ¥357 bn and operating income of ¥42.5 bn, contingent on successful new IP launches, repeat sales, and a planned lift in licensing income. Margin erosion from title underperformance remains a key risk. Capital allocation for FY2026/3 was restructured to focus on ¥190 bn of cumulative investment over FY2025–FY2027, allocating ¥80 bn to development, ¥120 bn to strategic acquisitions, and planning ¥70 bn in share buybacks while pausing large‑scale M&A. Shareholder returns are expected to rise sharply, with FY2026/3 projected at ¥31.5 bn (≈¥11.7 bn in dividends) and FY2027/3 potentially reaching ¥16.2 bn under a 50 % total‑return ratio applied to projected net income. Pachislot sales showed modest growth, buoyed by new titles and strong first‑week performance of flagship IPs such as “Hokuto No Ken” and “Kabaneri of the Iron Fortress.” Pachinko sales declined as the temporary lift from Lucky Trigger 3.0 Plus faded and hall utilization softened. The group plans to introduce reel‑exchangeable cabinets, expected to account for roughly 20 % of pachislot revenue, and is positioning the gaming business for a J‑curve bottom in FY2027 through intensive lease sales and B2B platform upgrades. The release schedule for FY2026/3 emphasizes a concentrated push of multi‑platform titles, including the Nintendo Switch 2 launch in March 2026 and a slate of global releases across consoles, PC, and mobile from late 2025 to mid‑2026. Key animation properties such as *Detective Conan* and *Lupin the Third* are slated for April–June 2025, with several new IPs and Netflix exclusives planned for early 2026. Pachislot and pachinko product launches are detailed with projected unit sales ranging from 8,000 to 49,000 units across varying gambling‑specification tiers.
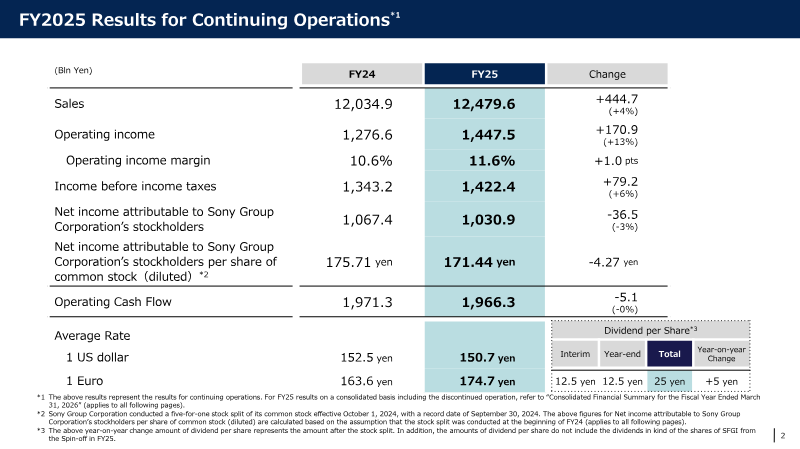
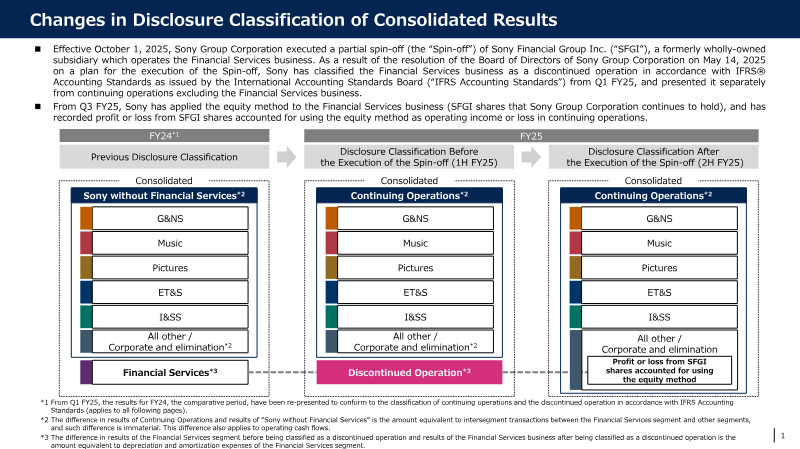
Sony Group’s FY2025 consolidated results demonstrate modest revenue growth and a mixed profitability profile across its core business units. Total sales increased 4 % to ¥12.48 trn, largely driven by higher operating income in the Imaging & Sensing Solutions (I&SS) and Music segments. Operating income rose 13 % to ¥1.45 trn, while net income attributable to shareholders fell 3 % to ¥1.03 trn because of a larger equity‑method loss in the Financial Services arm and higher impairment charges. Operating cash flow remained flat at ¥1.97 trn, and the spin‑off of Sony Financial Group was treated as a discontinued operation from Q1 FY25 onward. Within the Music division, sales climbed 15 % to ¥277.5 billion, propelled by growth in Recorded Music and Music Publishing streaming revenues (+9 % and +14 % respectively), live‑event income, and a strong contribution from the Demon Slayer franchise. Operating income in this segment surged 25 % to ¥89.7 billion, reaching a record high even after excluding one‑time items. Sony projects flat sales for FY2026, with operating income expected to decline 11 % to ¥47 billion as streaming gains are offset by the loss of Demon Slayer’s impact. The company consolidates its Pictures and Music results on a U.S. dollar basis, translating foreign‑currency sales and costs using weighted average exchange rates while accounting for hedging transactions. Foreign‑exchange fluctuations affect both sales and operating income, with I&SS hedging gains or losses incorporated into these calculations. These disclosures supplement, but do not replace, Sony’s IFRS‑compliant consolidated financial statements.