Related Documents
Report
Gaming Deals Activity Report: Q1–Q3 2022
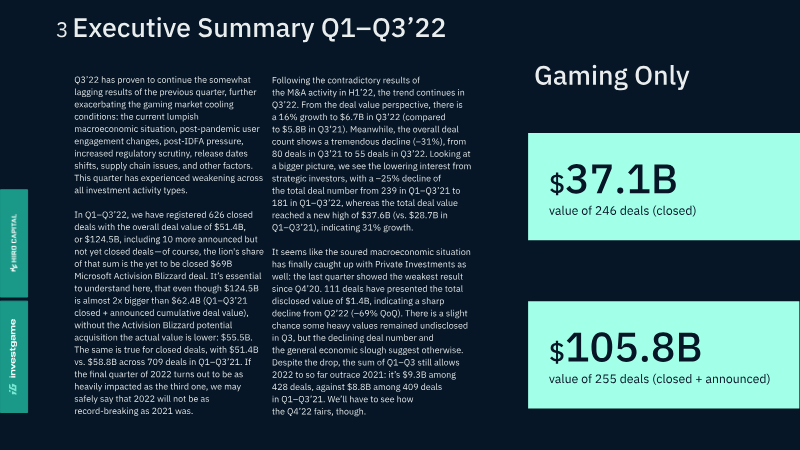
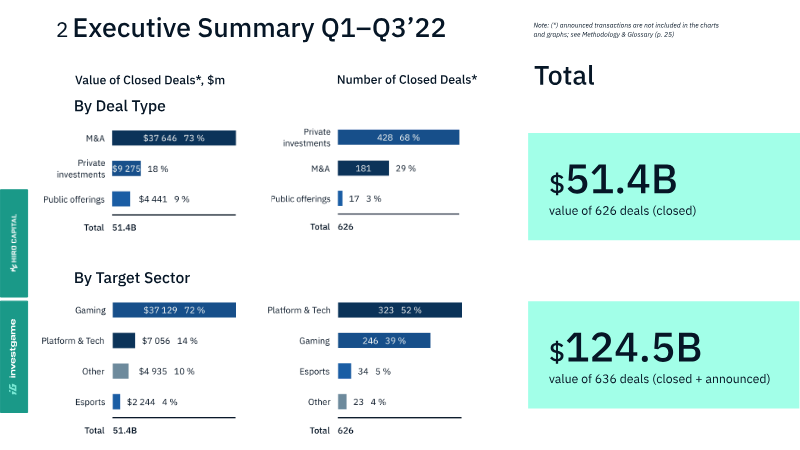
The gaming investment landscape in the first three quarters of 2022 reflects a significant market correction following a record-breaking 2021. While the total value of closed and announced deals reached $124.5 billion—nearly double the previous year's volume—this figure is heavily skewed by Microsoft’s pending $69 billion acquisition of Activision Blizzard. Excluding that single transaction, the market shows clear signs of cooling due to macroeconomic instability, post-pandemic shifts in user engagement, and increased regulatory scrutiny. Strategic mergers and acquisitions (M&A) remain the primary driver of deal value, reaching a record $101.4 billion year-to-date, despite a 40% decline in the number of closed transactions. Major players like Embracer Group, Sony, and Saudi Arabia’s Public Investment Fund (PIF) dominated this activity. Conversely, public offerings have nearly collapsed, reaching their lowest point since early 2020, with deal values shrinking fivefold compared to 2021. Private investments also saw a sharp decline in the third quarter, dropping 69% from the previous quarter, signaling that the "soured" economic climate has finally impacted venture capital and corporate rounds. The report highlights a notable shift in the blockchain and Web3 gaming sectors. While early-stage investment in this space previously drove market growth, the third quarter of 2022 marked the first period of negative growth for blockchain-related investments, with total deal value falling 14% year-over-year. Investors are becoming more selective, moving away from infrastructure platforms toward studios capable of producing engaging content. Geographically, the United States remains the most active market for gaming investments, followed by the United Kingdom and Turkey. Gender diversity remains a challenge for the industry, as 89% of companies receiving investment are male-led, with women-led entities representing only 2% of the total.
InvestGameJan 2022
Financial
Gaming Deals Activity Report: Q1 2022
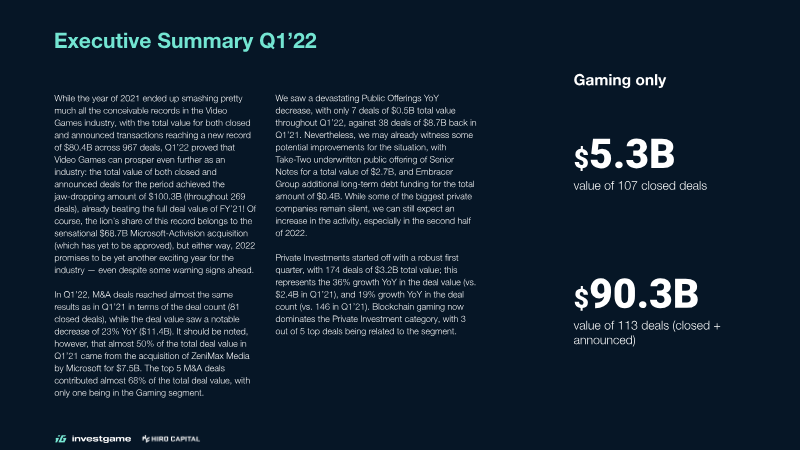
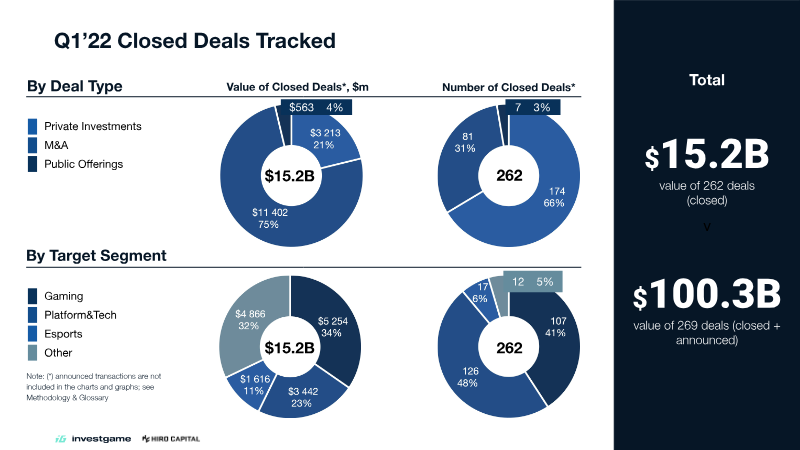
The primary aim of the Q1 2022 Gaming Deals Activity analysis is to quantify and interpret investment trends within the video‑game sector, offering stakeholders a data‑driven snapshot of market dynamics during the first quarter of 2022. By aggregating transaction records across all major regions, the study evaluates both total capital deployed and the frequency of deals, thereby establishing a benchmark for comparative performance. During the quarter, investors allocated roughly $1.1 billion to 52 distinct transactions, reflecting a sharp contraction relative to the previous year. Deal value fell to one‑quarter of the Q1 2021 level (a 2.5‑fold decline), while the number of agreements dropped by nearly half (a 1.9‑fold reduction). These figures signal a pronounced slowdown in financing activity, likely driven by broader macro‑economic pressures and heightened risk aversion among venture and private‑equity participants. The analysis also isolates the blockchain‑gaming niche, for which supplemental data were provided by Naavik, indicating that even emerging sub‑segments are not insulated from the overall downturn. Geographically, the dataset spans global markets, encompassing North America, Europe, Asia‑Pacific and emerging economies, and it covers the full spectrum of gaming‑related enterprises—from traditional publishers and developers to ancillary service providers and crypto‑gaming platforms. The report underscores that the observed decline is not merely a seasonal fluctuation but a substantive shift in capital allocation patterns, suggesting that investors may recalibrate strategies toward more resilient or diversified portfolios in the coming quarters.
Activision BlizzardJan 2022
Financial
Gaming Deals Activity Report H1'22
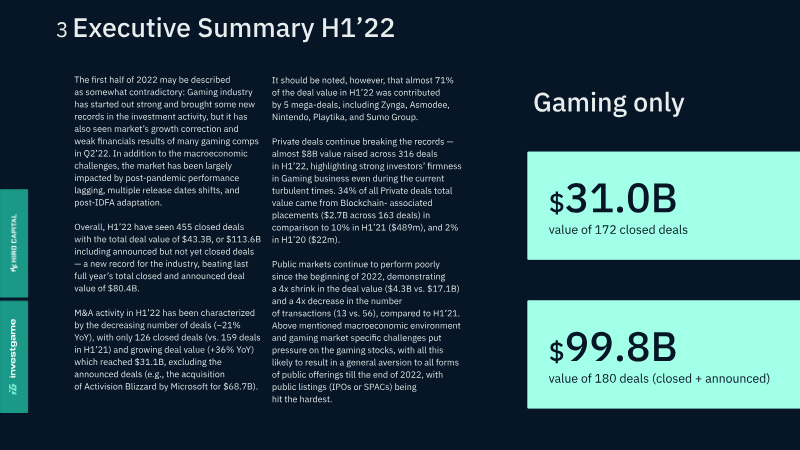
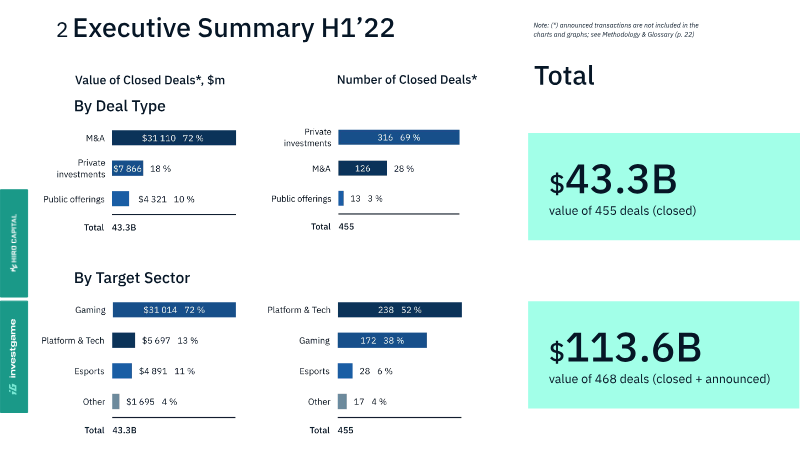
The first half of 2022 marked an unprecedented surge in gaming‑sector transactions, with 455 deals closed and a total value of $43.3 billion, rising to $113.6 billion when including announced but not yet finalized agreements. This activity set a new industry benchmark, reflecting heightened investor confidence and a broadening appetite for both mature and emerging gaming assets. Deal activity spanned the full spectrum of financing structures. Control‑oriented mergers and acquisitions dominated, while minority‑stake purchases, early‑stage venture capital, late‑stage venture capital, corporate strategic investments, IPOs and SPAC listings, fixed‑income instruments, and hybrid private‑public offerings each contributed to a diversified capital landscape. The data, compiled from public filings, market‑insight providers, and partner research, cover global markets and encompass all major video‑games subsectors, from console and PC titles to mobile and cloud‑based platforms. The analysis underscores that the record‑setting volume and value were driven not only by traditional M&A but also by an expanding ecosystem of venture and corporate funding, indicating a maturing market where both established publishers and nascent developers attract substantial capital. The report’s methodology emphasizes transparency and non‑advisory intent, positioning the findings as a reference point for industry participants rather than a basis for specific investment decisions. Access to the underlying deal tables and community insights is tiered across subscription levels, ranging from free access to comprehensive expert‑grade data, with sponsorship from Hiro Capital and Naavik noted as independent of the analytical conclusions.
InvestGameJan 2022
Report
Gaming Deals Activity Report Q1-Q3’2021
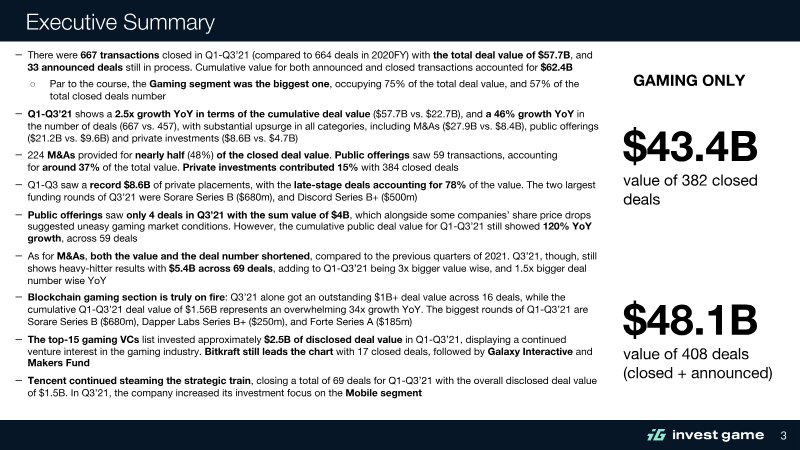
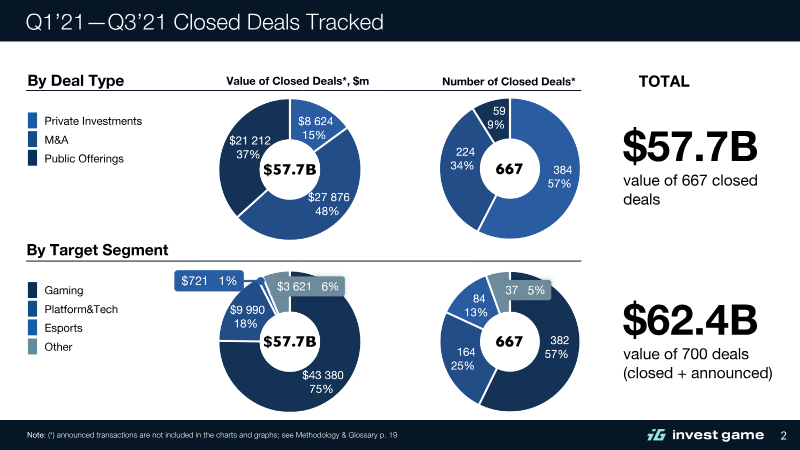
The global video game industry experienced unprecedented growth in deal activity during the first three quarters of 2021, reaching a total closed deal value of $57.7 billion across 667 transactions. This represents a 2.5x increase in cumulative value and a 46% increase in the number of deals compared to the same period in 2020. The market was primarily driven by the gaming segment, which accounted for 75% of total value, followed by platform and technology, esports, and other related sectors. Mergers and acquisitions served as the primary engine for this expansion, contributing $27.9 billion or 48% of the total closed deal value. Notable transactions included Microsoft’s $7.5 billion acquisition of ZeniMax Media and ByteDance’s $4 billion acquisition of Moonton. Public offerings contributed $21.2 billion, highlighted by the $3.75 billion IPO of Krafton. However, the report identifies a cooling trend in public markets during the third quarter, characterized by a decline in the number of deals and share price volatility for industry leaders. Private investments reached a record $8.6 billion, with late-stage venture capital accounting for 78% of that value, led by significant rounds for companies like Sorare and Discord. A major finding is the explosive rise of blockchain gaming, which saw a 34x year-over-year growth in deal value, totaling $1.56 billion. Investors showed a strong preference for infrastructure and platform layers that enable blockchain integration, rather than individual game titles. Geographically, the report highlights the continued dominance of strategic investors like Tencent, which closed 69 deals during the period, focusing heavily on the mobile segment and the Chinese market. The analysis is based on data from InvestGame and S&P Capital IQ, tracking closed transactions across mobile, PC, console, and VR/AR segments while excluding pure gambling and betting. The methodology utilizes a weighted average ranking system to identify the most active venture capital and strategic investors globally.
InvestGameJan 2021