
The interim report for January to June 2025 documents a sharp contraction in G5 Entertainment’s top line, with revenue falling 20 % year‑on‑year to SEK 231.6 million (US$38.8 million). The decline is attributed to a weaker U.S. dollar and reduced spend on user acquisition, while the company’s gross margin improved to 70.0 % from 67.8 %. Earnings before interest and taxes slipped 74 % to SEK 5.6 million (2.4 % margin), largely due to a SEK 10 million foreign‑exchange revaluation and a substantial dividend payout. Adjusted EBIT, excluding finance items, would have been SEK 6.8 million.
Net profit dropped to SEK 6.9 million (EPS SEK 0.88) from SEK 23.5 million the previous year, and cash flow turned negative at SEK 38.8 million after a SEK 62.2 million dividend; operating cash flow before financing stood at SEK 25.7 million. Despite these setbacks, the company remains cash‑positive on a pre‑dividend basis and continues to invest in user acquisition and third‑party store expansion, particularly through its direct‑to‑consumer G5 Store.
The report confirms that it presents a true and fair view of the company’s operations, financial position and results for the first half of 2025. It is filed under Swedish securities law, published in both Swedish and English, and has not yet been audited; the Swedish version prevails over any translation discrepancies.
Operating expenses are broken down into marketing (general, branding, advertising and public relations) and general & administrative costs (salaries, bonuses, benefits, consulting, legal, accounting and depreciation). Key performance metrics such as Monthly Average Gross Revenue Per Paying User (MAGRPPU) and Monthly Unique Payer figures are also disclosed, providing insight into revenue generation per user and payer volume trends.

Modern Times Group · 2026

Almedia · 2026
Sensor Tower · 2026

Sensor Tower · 2026
AppLovin · 2026

Sensor Tower · 2026
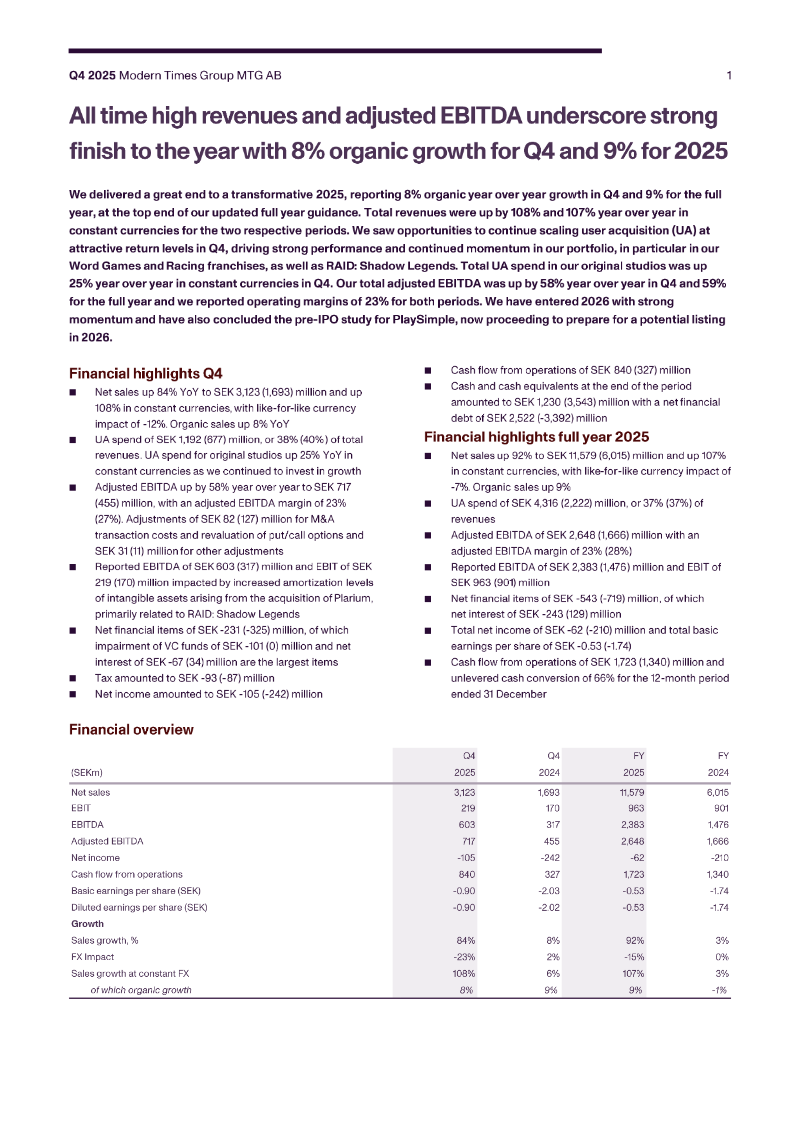
Modern Times Group · 2026

AppMagic · 2026

InvestGame · 2026
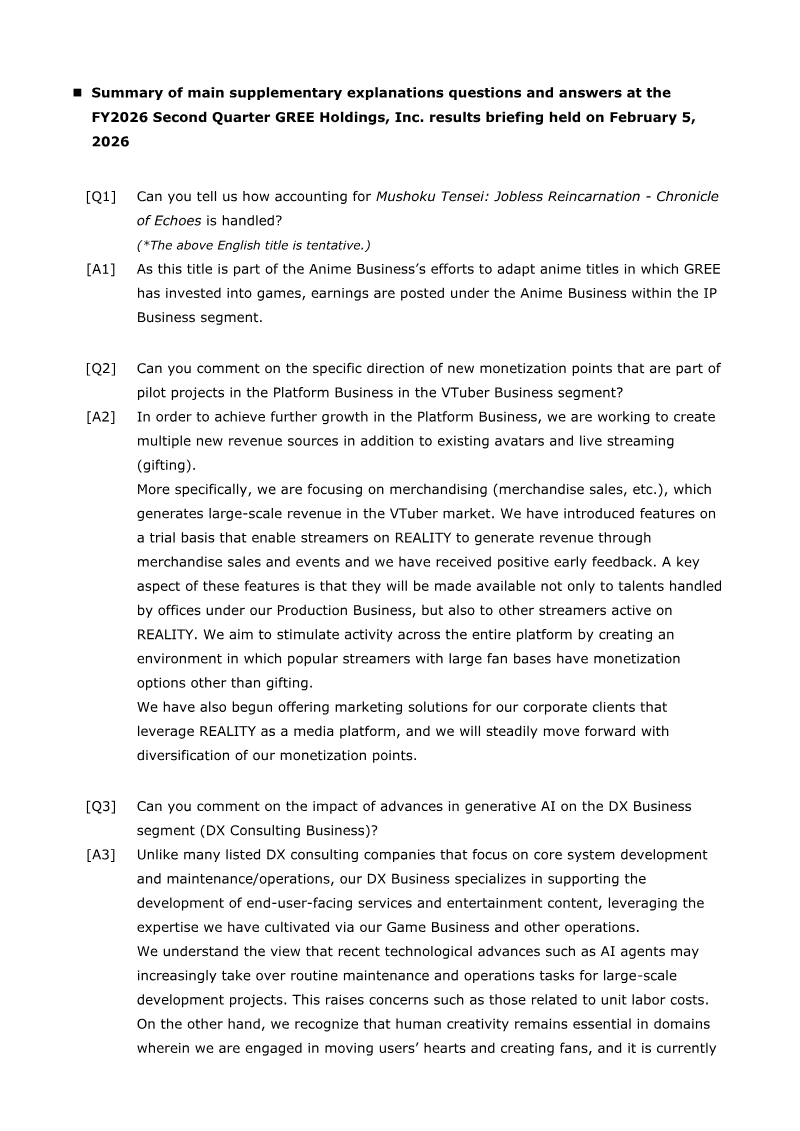
GREE · 2026

InvestGame · 2026

InvestGame · 2026