Related Documents
Financial
Financial Highlights for the 3rd Quarter of the Fiscal Year Ending March 2018 (FY2017)
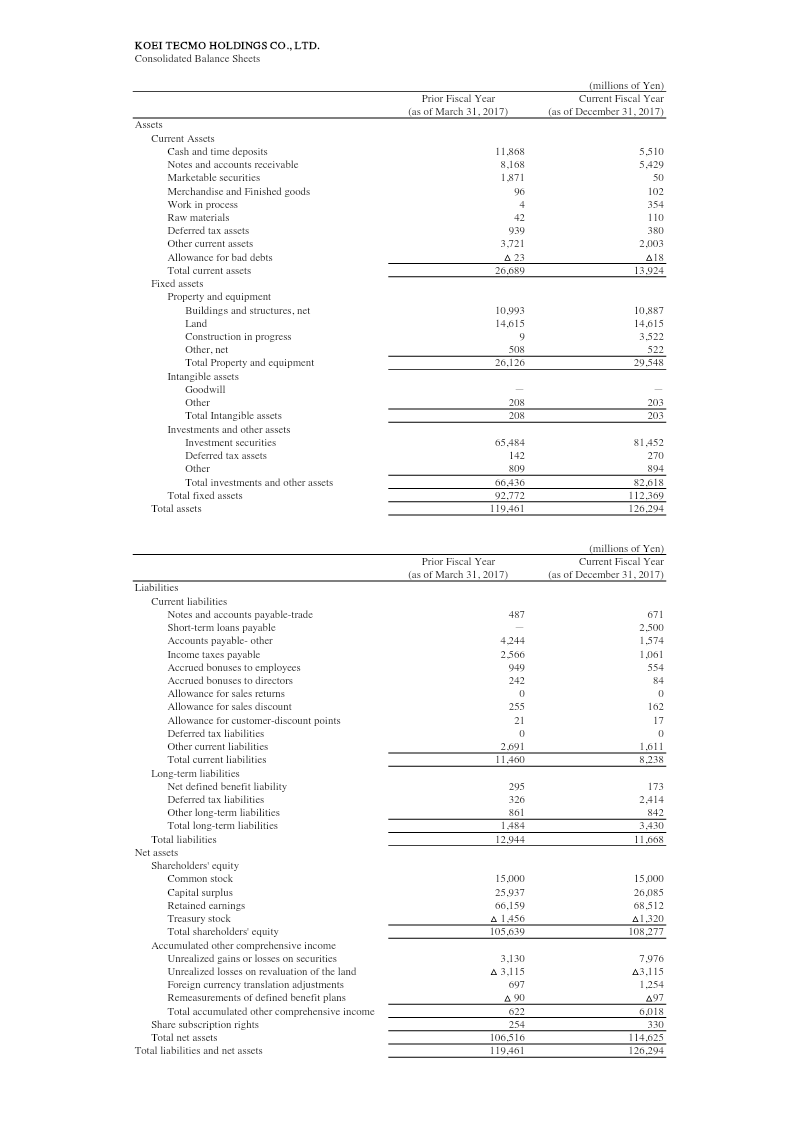
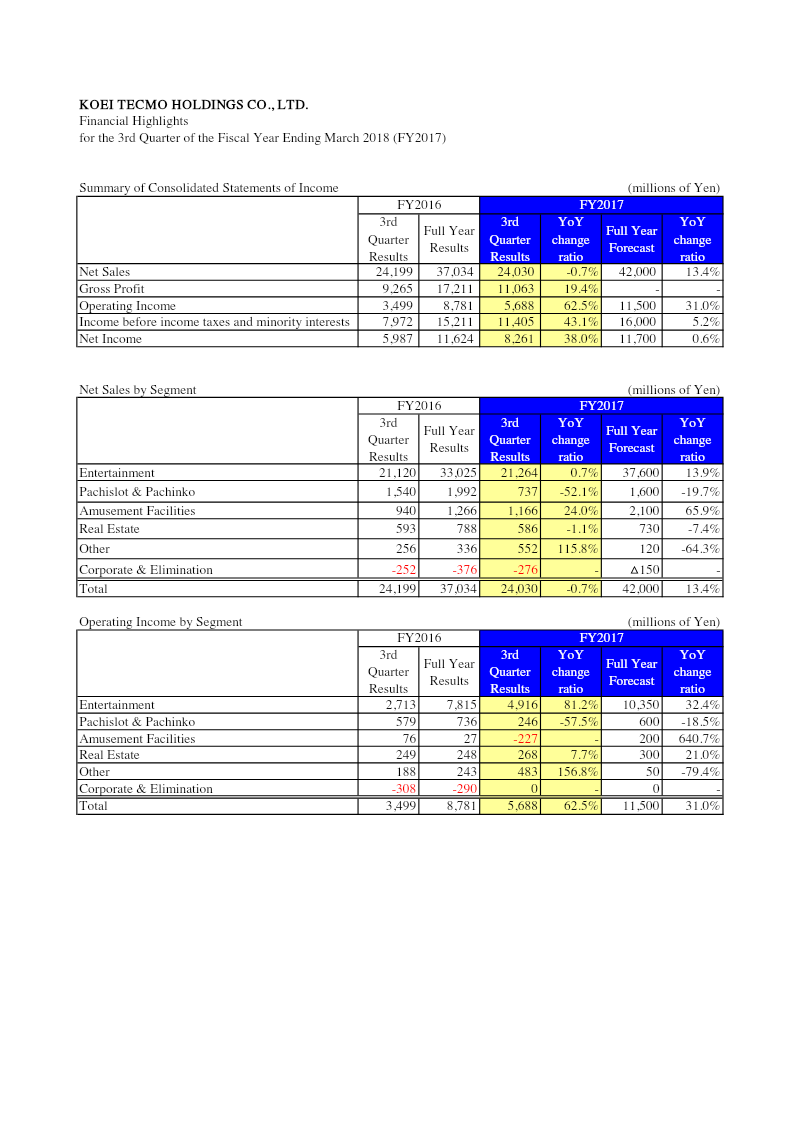
Koei Tecmo Holdings reported strong profitability growth for the third quarter of the fiscal year ending March 2018, despite a slight softening in top-line revenue. While net sales saw a marginal year-over-year decline of 0.7% to 24.03 billion yen, the company achieved significant improvements in its bottom-line performance. Operating income rose by 62.5% to 5.69 billion yen, and net income increased by 38.0% to 8.26 billion yen. This growth was driven by enhanced operational efficiency, as evidenced by a 19.4% increase in gross profit. The Entertainment segment remains the primary driver of the business, contributing 21.26 billion yen in sales and 4.92 billion yen in operating income, the latter representing an 81.2% year-over-year increase. In contrast, the Pachislot & Pachinko segment experienced a sharp decline, with sales falling 52.1% and operating income dropping 57.5%. The Amusement Facilities segment saw a 24.0% rise in sales but recorded an operating loss of 227 million yen for the period. On the balance sheet, total assets grew to 126.29 billion yen as of December 31, 2017. This growth was largely fueled by a substantial increase in investment securities, which rose from 65.48 billion yen to 81.45 billion yen. The company maintains a robust equity position with total net assets of 114.63 billion yen. Looking ahead to the full fiscal year, the company forecasts a recovery in sales to 42.0 billion yen, representing a 13.4% annual increase, while maintaining a positive outlook for continued growth in operating and net income.
Koei TecmoJan 2017
Financial
Financial Highlights for the 3rd Quarter of the Fiscal Year Ending March 2020 (FY2019)
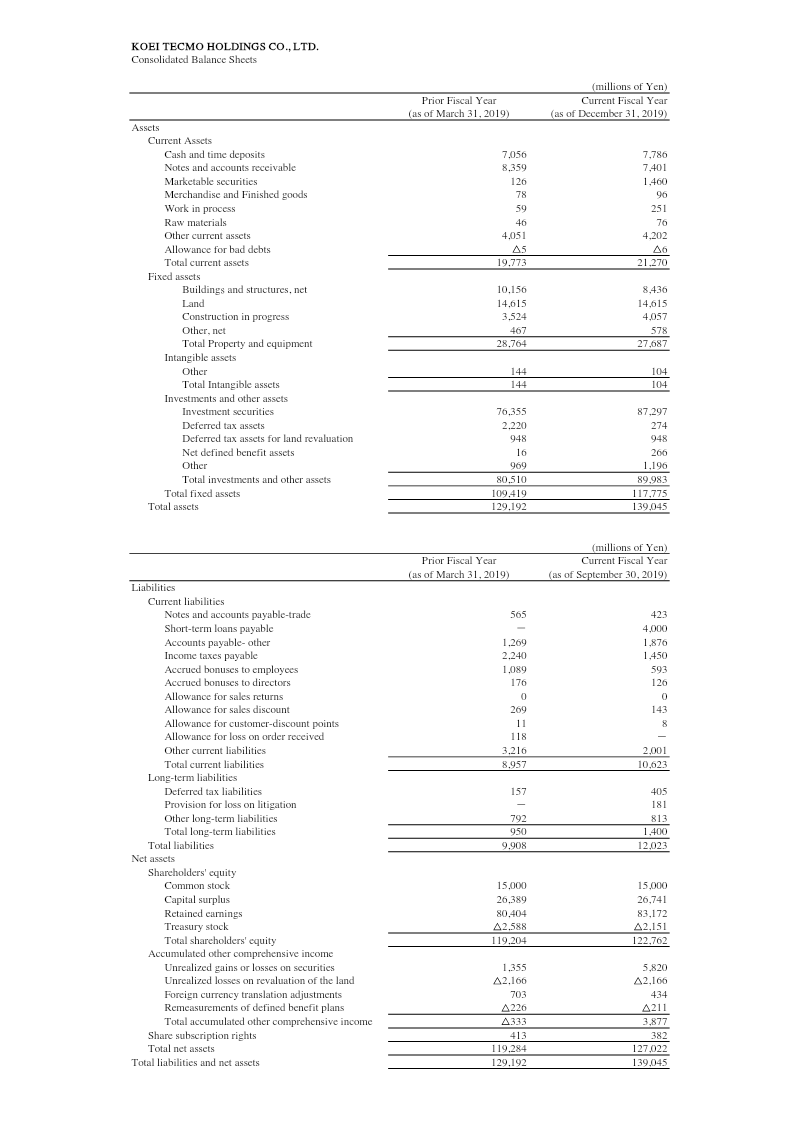
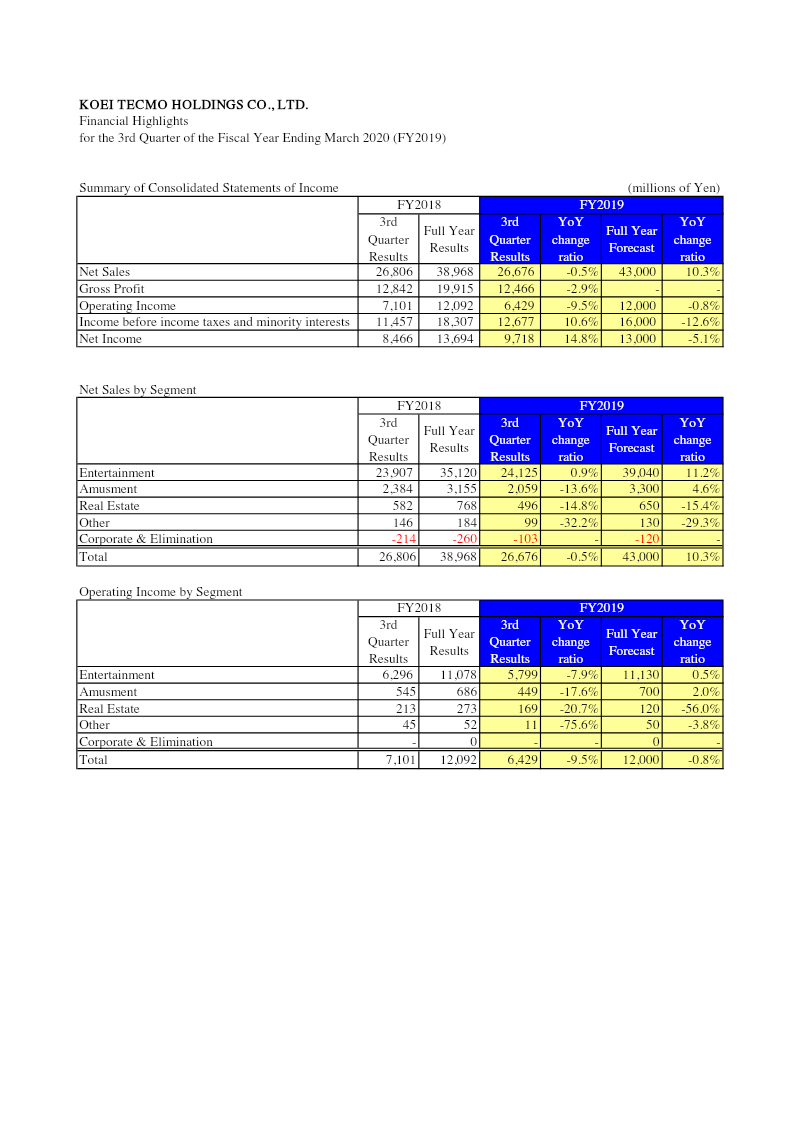
Koei Tecmo Holdings Co., Ltd. presents its financial performance for the third quarter of the fiscal year ending March 2020, covering the nine-month period ending December 31, 2019. The data reflects a period of mixed financial results characterized by a slight decline in top-line revenue and operating income, contrasted by significant growth in net income and total assets. The primary focus of the analysis is the Entertainment segment, which remains the dominant driver of the company’s business operations. Net sales for the third quarter reached 26.68 billion yen, representing a marginal 0.5% decrease compared to the same period in the previous year. Operating income saw a more pronounced decline of 9.5%, falling to 6.43 billion yen. Despite these contractions in core operational profitability, income before taxes rose by 10.6% to 12.68 billion yen, and net income increased by 14.8% to 9.72 billion yen. This discrepancy suggests strong non-operating performance, likely tied to the company’s investment activities. The Entertainment segment contributed the vast majority of revenue at 24.13 billion yen, showing a slight year-over-year increase of 0.9%. Other segments, including Amusement, Real Estate, and Other businesses, all experienced double-digit declines in both sales and operating income during the quarter. Geographically and operationally, the company maintains a robust balance sheet, with total assets increasing from 129.19 billion yen at the end of the prior fiscal year to 139.05 billion yen. This growth was largely driven by a substantial increase in investment securities, which rose from 76.36 billion yen to 87.30 billion yen. Looking ahead, the full-year forecast anticipates a recovery in sales to 43 billion yen, a 10.3% increase over the previous year's results. However, the company expects a slight 0.8% decrease in full-year operating income and a 5.1% decline in net income compared to the prior year's totals, indicating a cautious outlook for the final quarter of the fiscal year.
Koei TecmoJan 2020
Financial
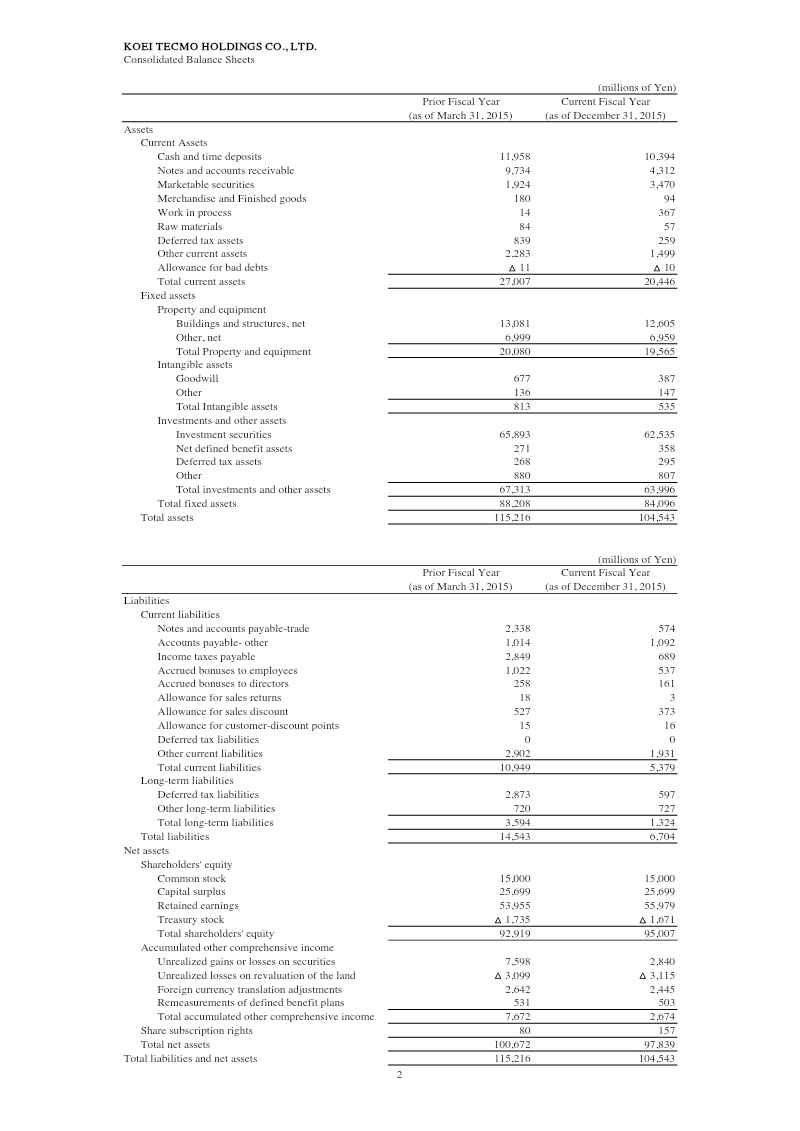
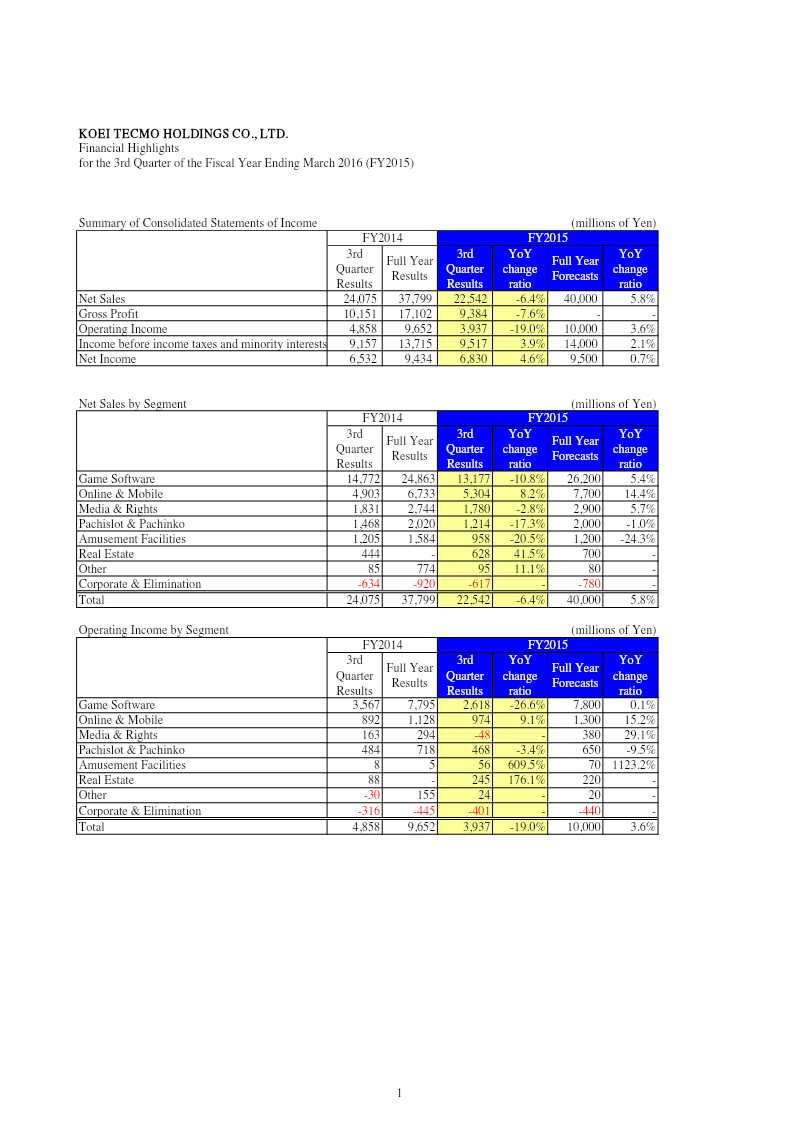
Financial Highlights for the 3rd Quarter of the Fiscal Year Ending March 2016 (FY2015)
Koei Tecmo Holdings reported its financial results for the third quarter of the fiscal year ending March 2016, revealing a period of mixed performance characterized by declining top-line revenue but improved net profitability. For the nine-month period ending December 31, 2015, net sales reached 22.54 billion yen, representing a 6.4% decrease compared to the same period in the previous year. Operating income also saw a significant year-over-year contraction of 19.0%, falling to 3.94 billion yen. Despite these declines in operational performance, net income rose by 4.6% to 6.83 billion yen, supported by strong non-operating figures that bolstered income before taxes. The performance across business segments was varied. The core Game Software division experienced a 10.8% drop in sales and a 26.6% decline in operating income, reflecting a challenging period for traditional packaged software. Conversely, the Online & Mobile segment demonstrated growth, with sales increasing by 8.2% to 5.30 billion yen and operating income rising by 9.1%. Other smaller segments, such as Amusement Facilities and Real Estate, showed improved profitability despite their smaller scale, while the Media & Rights division swung to a small operating loss. Geographically focused on the Japanese market with global reach through its software titles, the company remains optimistic about its full-year outlook. Management maintained forecasts that project a recovery in the fourth quarter, targeting annual net sales of 40 billion yen and a net income of 9.5 billion yen. The balance sheet remains liquid, though total assets decreased from 115.2 billion yen at the start of the fiscal year to 104.5 billion yen, primarily driven by a reduction in notes and accounts receivable and a decrease in the valuation of investment securities. Net assets stood at 97.8 billion yen at the end of the third quarter.
Koei TecmoJan 2015
Financial
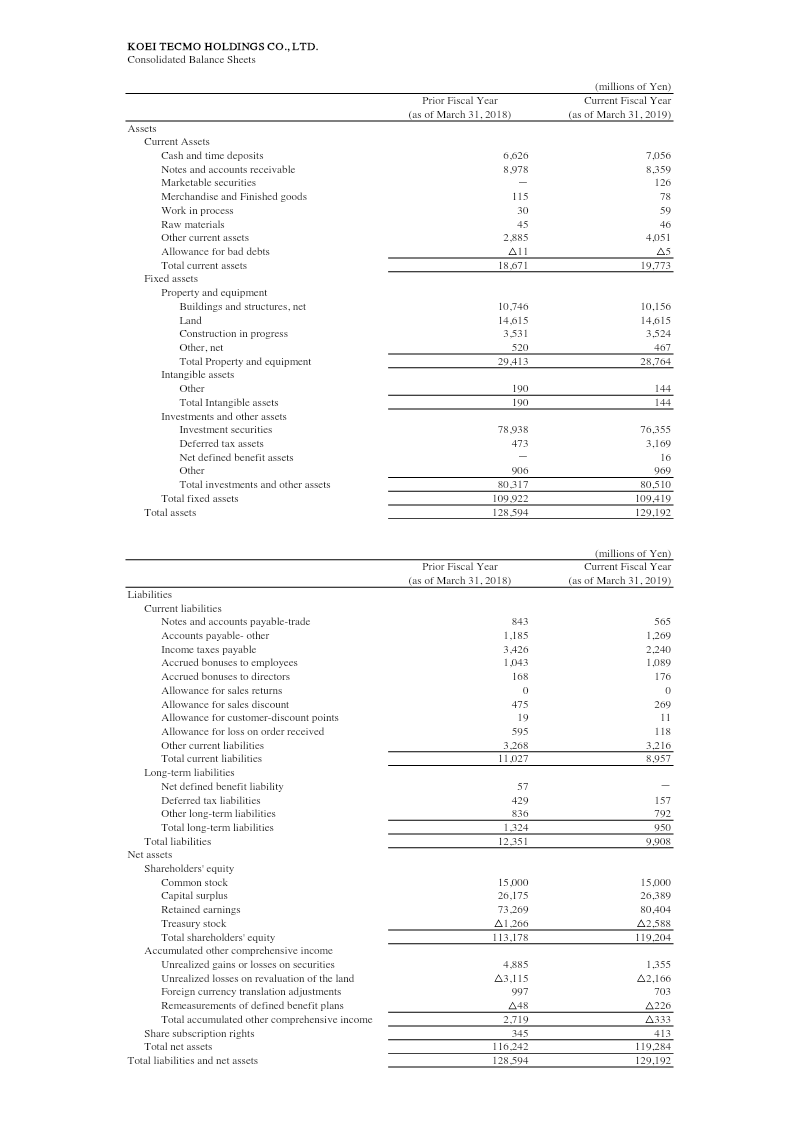
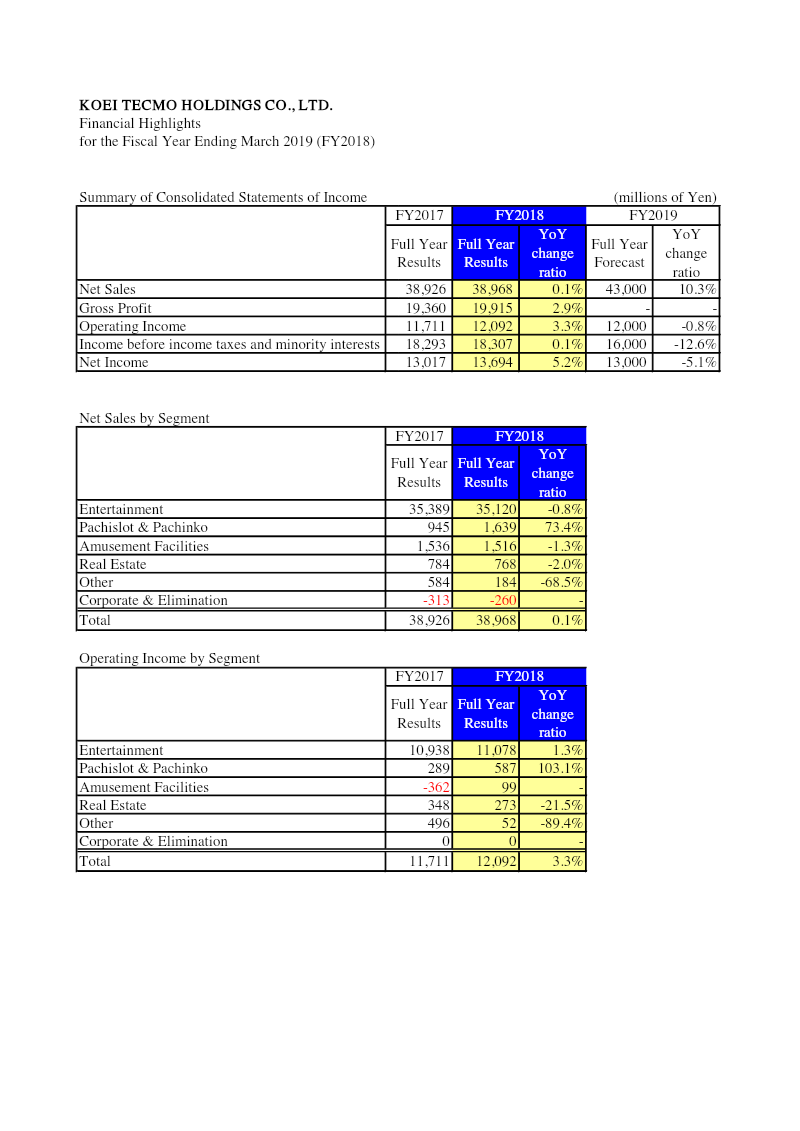
Financial Highlights for the Fiscal Year Ending March 2019 (FY2018)
Koei Tecmo Holdings achieved steady financial growth during the fiscal year ending March 31, 2019, characterized by record-level profits and a stable expansion of its core business segments. Net sales reached 38,968 million yen, representing a slight year-on-year increase, while operating income rose by 3.3% to 12,092 million yen. The most significant growth was observed in net income, which climbed 5.2% to 13,694 million yen. These results demonstrate the company's ability to maintain high profitability margins, with gross profit improving by 2.9% despite relatively flat top-line revenue growth. The Entertainment segment remains the primary driver of corporate value, contributing 35,120 million yen in sales and the vast majority of operating income at 11,078 million yen. While Entertainment sales saw a marginal dip of 0.8%, the Pachislot and Pachinko segment experienced a dramatic surge, with sales increasing by 73.4% and operating income doubling to 587 million yen. The Amusement Facilities segment also showed a successful turnaround, moving from an operating loss in the previous year to a profit of 99 million yen. Conversely, the Real Estate and Other segments saw declines in both revenue and operating income, though their overall impact on the consolidated balance sheet remains secondary to the core gaming and entertainment divisions. The corporate financial position is robust, with total assets valued at 129,192 million yen. A significant portion of the company’s strength is tied to its investment activities, evidenced by 76,355 million yen held in investment securities. Total net assets grew to 119,284 million yen, supported by a substantial increase in retained earnings, which rose from 73,269 million yen to 80,404 million yen. Looking forward to the fiscal year ending March 2020, the company forecasts a 10.3% increase in net sales to 43,000 million yen, though it anticipates a slight contraction in net income to 13,000 million yen.
Koei TecmoJan 2019