Related Documents
Financial
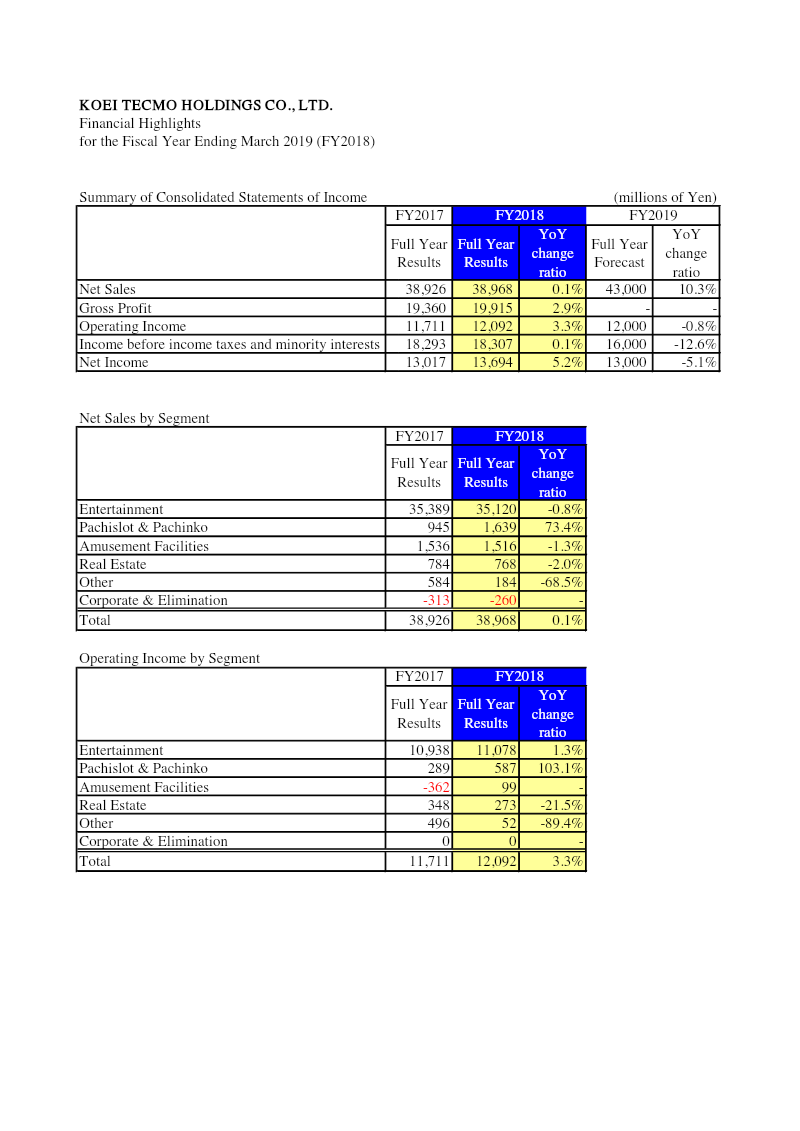
Financial Highlights for the Fiscal Year Ending March 2019 (FY2018)
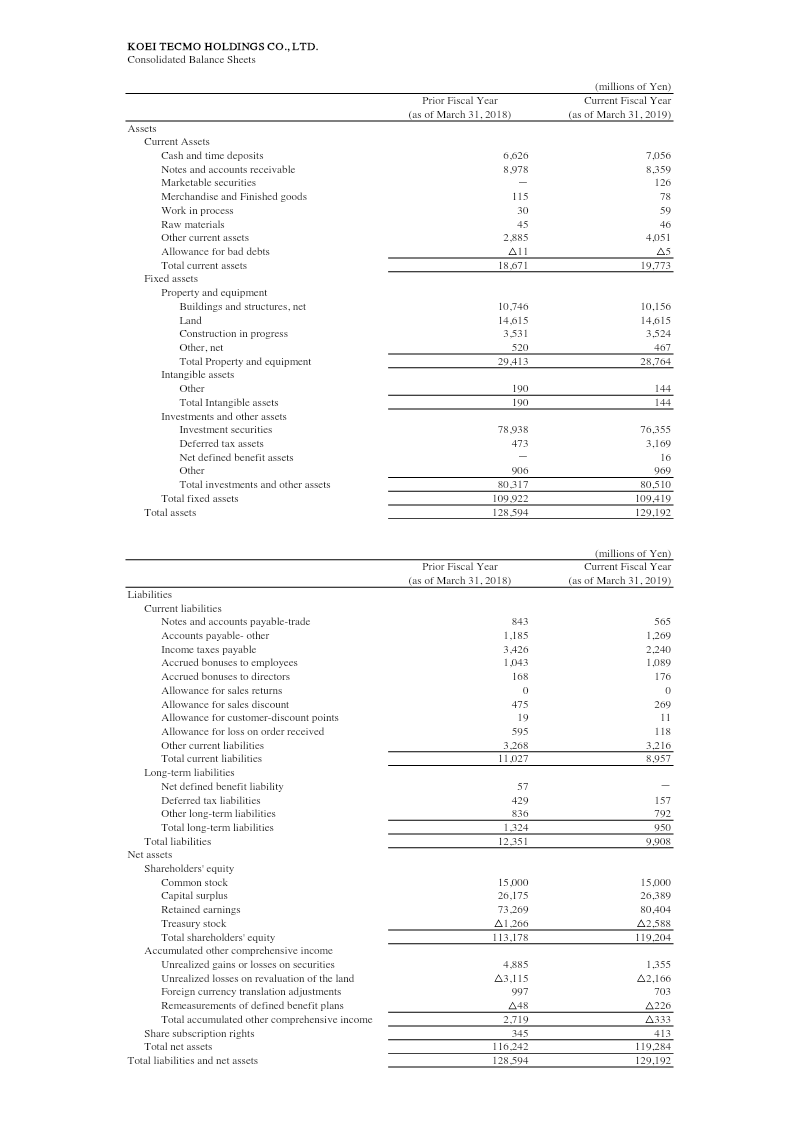
Koei Tecmo Holdings achieved steady financial growth during the fiscal year ending March 31, 2019, characterized by record-level profits and a stable expansion of its core business segments. Net sales reached 38,968 million yen, representing a slight year-on-year increase, while operating income rose by 3.3% to 12,092 million yen. The most significant growth was observed in net income, which climbed 5.2% to 13,694 million yen. These results demonstrate the company's ability to maintain high profitability margins, with gross profit improving by 2.9% despite relatively flat top-line revenue growth. The Entertainment segment remains the primary driver of corporate value, contributing 35,120 million yen in sales and the vast majority of operating income at 11,078 million yen. While Entertainment sales saw a marginal dip of 0.8%, the Pachislot and Pachinko segment experienced a dramatic surge, with sales increasing by 73.4% and operating income doubling to 587 million yen. The Amusement Facilities segment also showed a successful turnaround, moving from an operating loss in the previous year to a profit of 99 million yen. Conversely, the Real Estate and Other segments saw declines in both revenue and operating income, though their overall impact on the consolidated balance sheet remains secondary to the core gaming and entertainment divisions. The corporate financial position is robust, with total assets valued at 129,192 million yen. A significant portion of the company’s strength is tied to its investment activities, evidenced by 76,355 million yen held in investment securities. Total net assets grew to 119,284 million yen, supported by a substantial increase in retained earnings, which rose from 73,269 million yen to 80,404 million yen. Looking forward to the fiscal year ending March 2020, the company forecasts a 10.3% increase in net sales to 43,000 million yen, though it anticipates a slight contraction in net income to 13,000 million yen.
Koei TecmoJan 2019
Financial
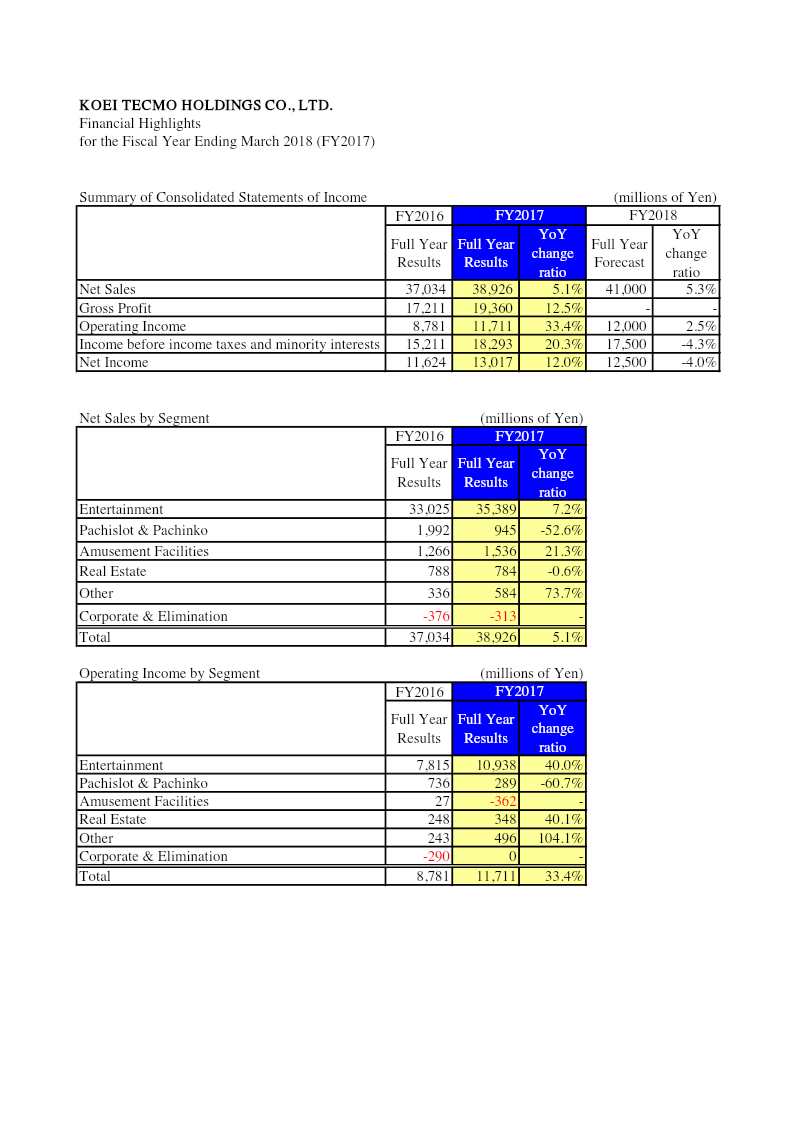
Financial Highlights: Fiscal Year Ending March 2018 (FY2017)
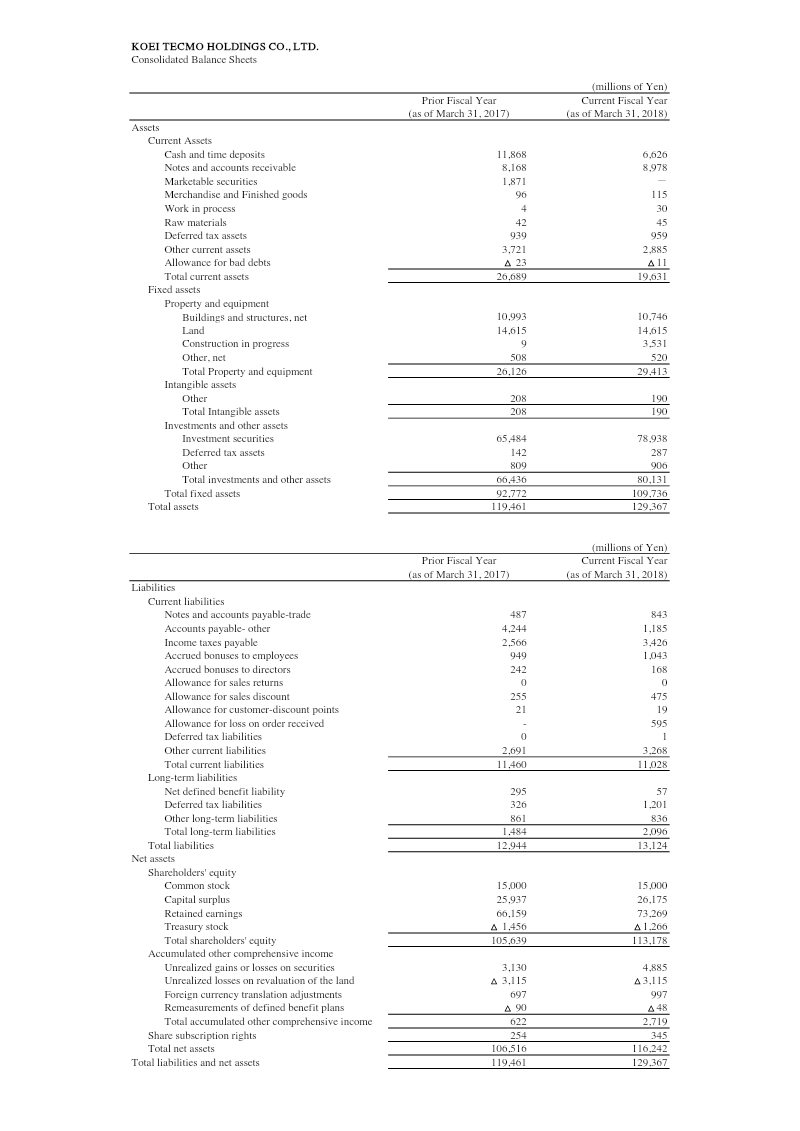
Koei Tecmo Holdings achieved significant financial growth during the fiscal year ending March 31, 2018, characterized by a substantial increase in profitability despite modest top-line expansion. Net sales rose by 5.1% to reach 38,926 million yen, while operating income surged by 33.4% to 11,711 million yen. This performance was driven primarily by the core Entertainment segment, which saw a 7.2% increase in sales and a 40% jump in operating income. Net income for the period reached 13,017 million yen, representing a 12% year-over-year improvement. The Entertainment division remains the dominant revenue driver, contributing 35,389 million yen to the total sales mix. In contrast, the Pachislot and Pachinko segment experienced a sharp decline, with sales falling by 52.6% and operating income dropping by over 60%. While the Amusement Facilities segment saw a 21.3% increase in sales, it recorded an operating loss of 362 million yen. Other smaller segments, including Real Estate and miscellaneous categories, showed varied performance but remained minor contributors to the overall corporate portfolio. The consolidated balance sheet reflects a strong capital position, with total assets increasing from 119,461 million yen to 129,367 million yen. A notable shift occurred in the asset structure, as cash and time deposits decreased while investment securities grew significantly to 78,938 million yen. Total net assets rose to 116,242 million yen, supported by a healthy increase in retained earnings. Looking forward to the 2018 fiscal year, forecasts suggest continued sales growth to 41,000 million yen, though net income is projected to stabilize with a slight 4% decrease compared to the 2017 results.
Koei TecmoMar 2018
Financial
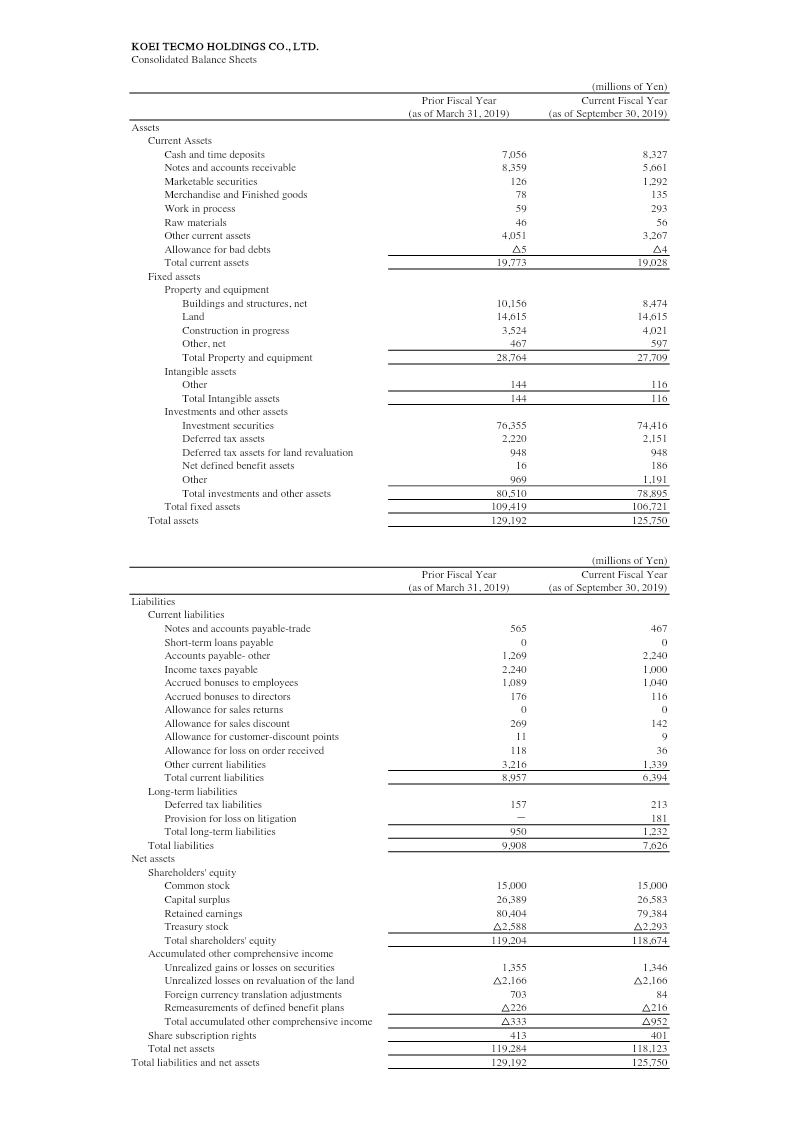
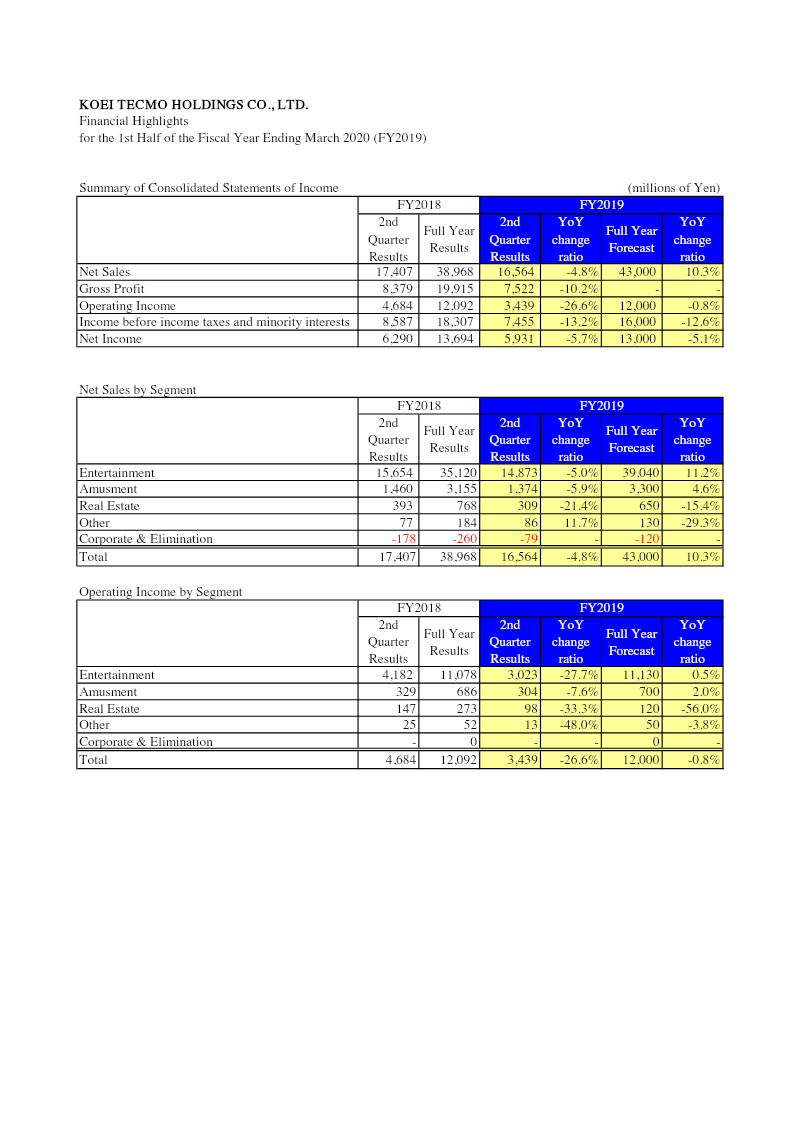
Financial Highlights for the 1st Half of the Fiscal Year Ending March 2020 (FY2019)
Koei Tecmo Holdings reported a moderate decline in financial performance for the first half of the fiscal year ending March 2020. During the six-month period concluding September 30, 2019, net sales reached 16.56 billion yen, representing a 4.8% decrease compared to the same period in the previous year. Operating income saw a more significant contraction, falling 26.6% to 3.44 billion yen, while net income declined by 5.7% to 5.93 billion yen. The entertainment segment remains the primary driver of the company’s business, accounting for 14.87 billion yen in sales, though it experienced a 5.0% year-over-year decrease. Other business units, including amusement and real estate, also reported lower sales and operating income. Despite the downward trend in the first half, the full-year forecast remains optimistic regarding top-line growth, projecting total net sales of 43.0 billion yen, which would constitute a 10.3% increase over the prior full fiscal year. However, full-year net income is expected to decrease by 5.1% to 13.0 billion yen. The consolidated balance sheet indicates a strong asset position, with total assets valued at 125.75 billion yen. A substantial portion of the company’s value is held in fixed assets, specifically 74.4 billion yen in investment securities. Shareholders' equity remains robust at 118.67 billion yen, contributing to a total net asset value of 118.12 billion yen. The data reflects a period of transition where short-term earnings have softened, yet the company maintains a stable capital base and anticipates a recovery in sales volume by the end of the fiscal year.
Koei TecmoJan 2019
Financial
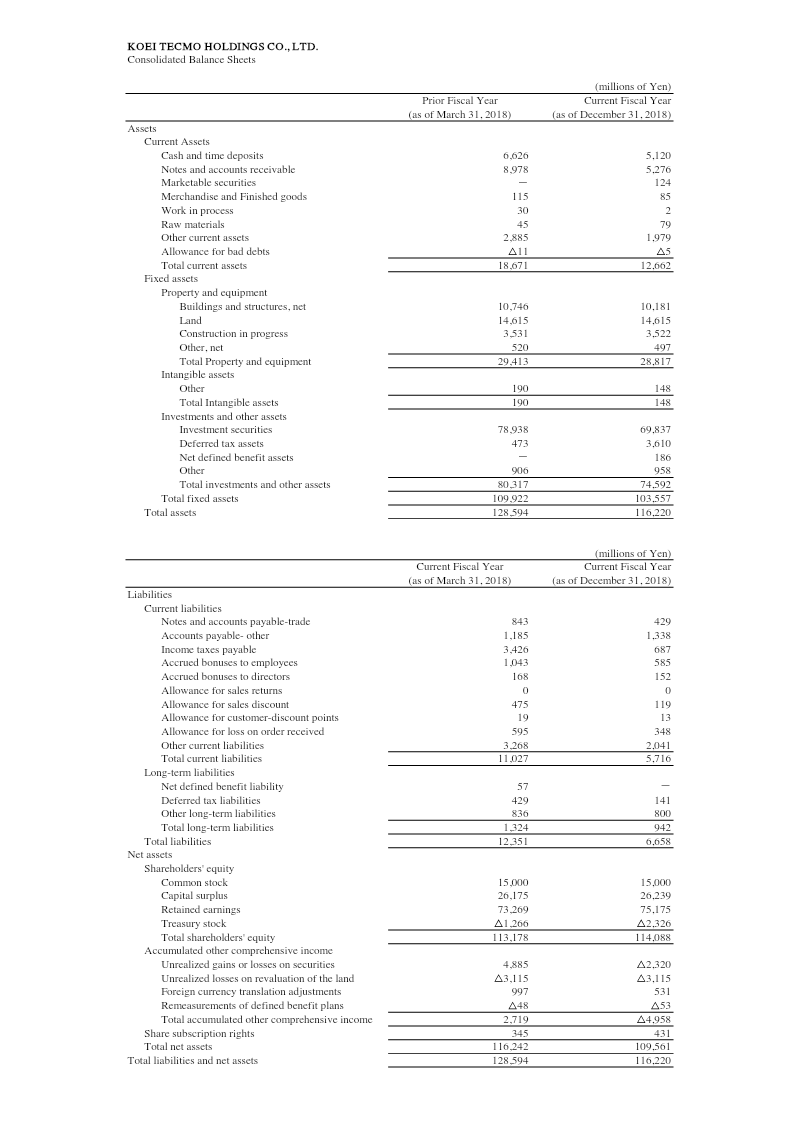
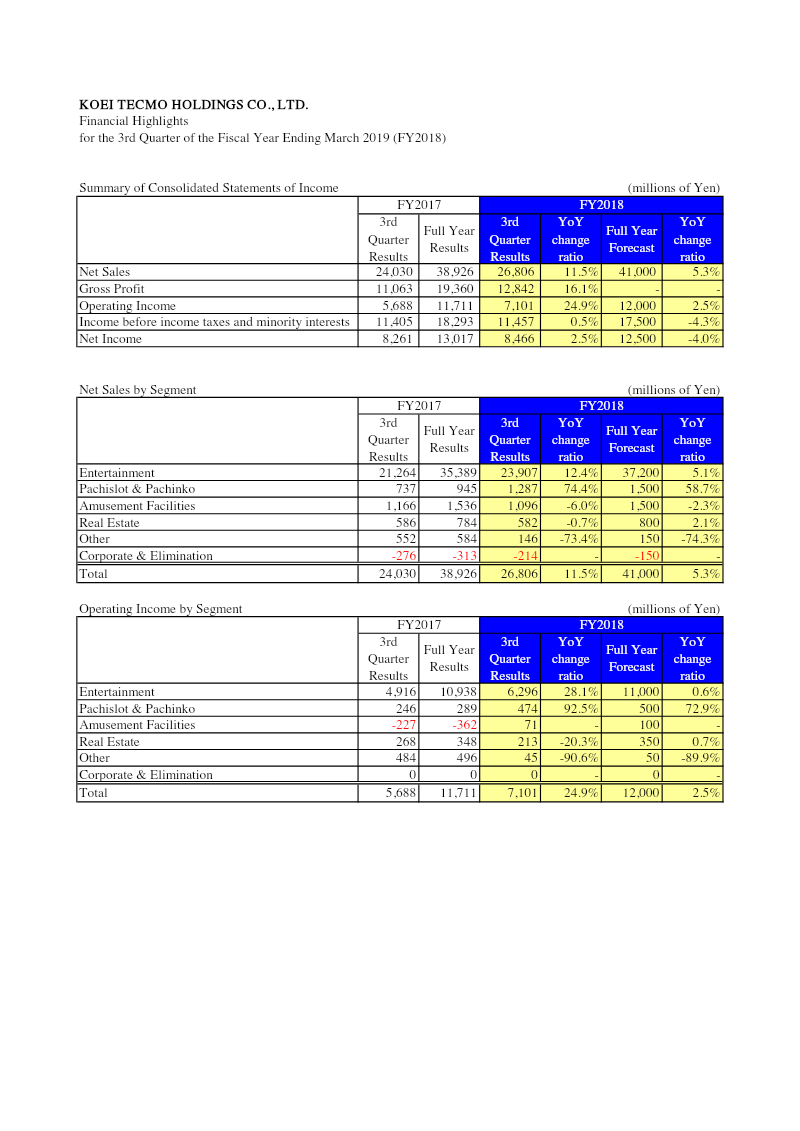
Financial Highlights for the 3rd Quarter of the Fiscal Year Ending March 2019 (FY2018)
Koei Tecmo Holdings Co., Ltd. reported strong financial performance for the third quarter of the fiscal year ending March 2019, characterized by double-digit growth in both revenue and operating profitability. Net sales reached 26.8 billion yen, an 11.5% increase over the same period in the previous year, while operating income rose significantly by 24.9% to 7.1 billion yen. This growth was primarily driven by the core Entertainment segment, which remains the company’s largest business unit, contributing 23.9 billion yen in sales and 6.3 billion yen in operating income. The Pachislot & Pachinko segment also demonstrated substantial momentum, with sales increasing by 74.4% and operating income nearly doubling year-over-year. In contrast, the Amusement Facilities and Real Estate segments saw slight declines in revenue, though the Amusement Facilities division successfully returned to profitability during the period. Despite the strong operational performance, net income growth was more modest at 2.5%, totaling 8.47 billion yen, as non-operating factors and market fluctuations influenced the bottom line. The consolidated balance sheet as of December 31, 2018, shows total assets of 116.2 billion yen, a decrease from the 128.6 billion yen reported at the end of the previous fiscal year. This reduction was largely driven by a decrease in investment securities and accounts receivable. Shareholders' equity remained robust at 114.1 billion yen, though total net assets were impacted by unrealized losses on securities. Looking ahead, the company maintains a positive full-year forecast, projecting net sales of 41 billion yen and operating income of 12 billion yen, signaling continued confidence in its core entertainment software and licensing businesses.
Koei TecmoJan 2018