Related Documents
Financial
Consolidated Financial Results for the Six Months Ended September 30, 2021
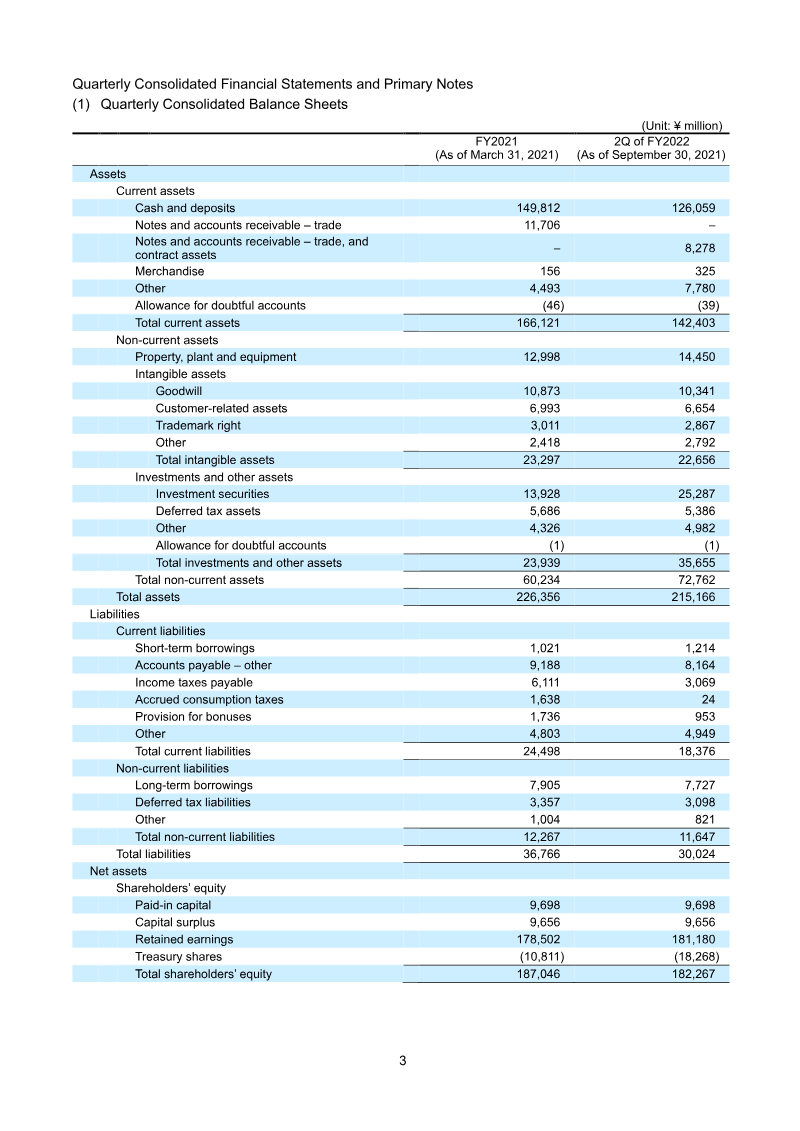
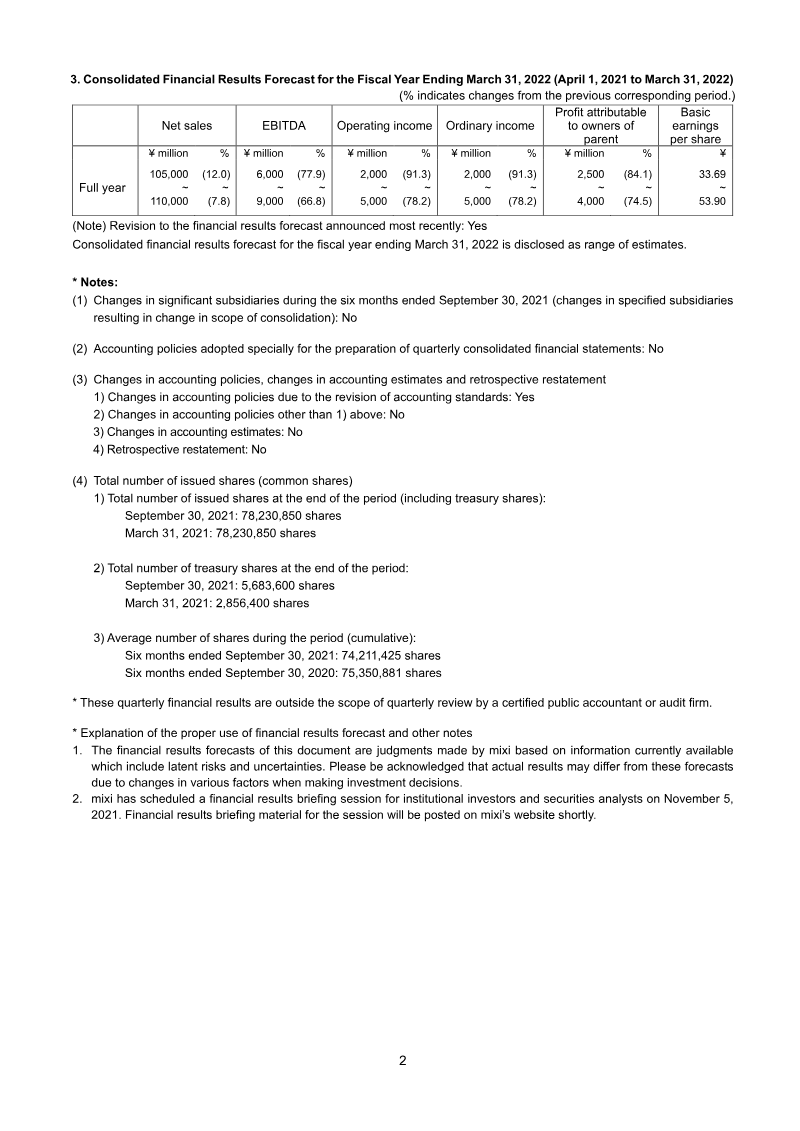
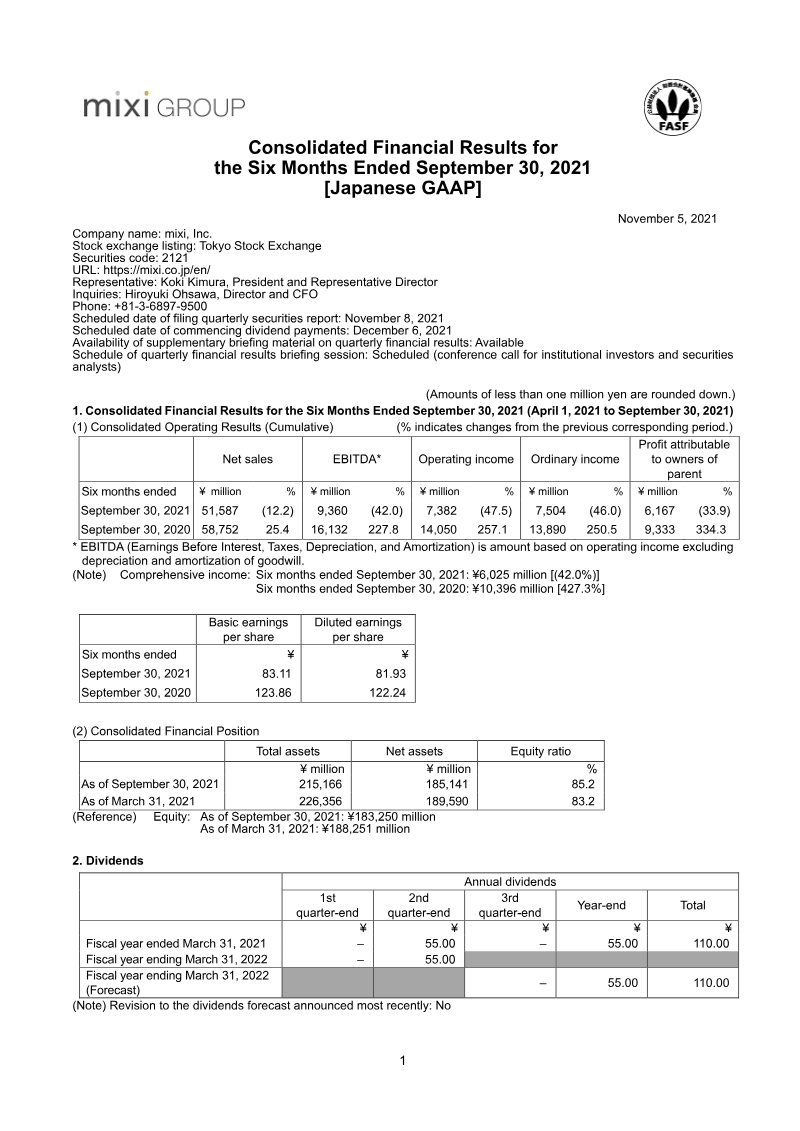
Mixi, Inc. reported a decline in financial performance for the first half of the fiscal year ending March 31, 2022, covering the period from April 1, 2021, to September 30, 2021. Net sales reached ¥51,587 million, a 12.2% decrease compared to the same period in the previous year. Profitability saw a more significant contraction, with operating income falling 47.5% to ¥7,382 million and profit attributable to owners of the parent decreasing 33.9% to ¥6,167 million. Despite these declines, the company maintained a strong financial position with an equity ratio of 85.2% and total assets of ¥215,166 million. The Digital Entertainment Business, primarily driven by the flagship title Monster Strike, remains the company's largest segment but experienced a drop in net sales from ¥51,438 million to ¥40,699 million. Conversely, the Sports Business saw growth, with revenue increasing from ¥5,377 million to ¥8,000 million, though it continued to operate at a segment loss. The Lifestyle Business showed improvement, moving from a loss to a modest profit of ¥48 million. A significant portion of the report details the adoption of new Accounting Standards for Revenue Recognition. For Monster Strike, the company transitioned from recognizing revenue at the point of in-game currency consumption to recognizing it over the estimated period of character use. Additionally, transaction prices are now allocated across both paid and free "orbs" because they provide equivalent functional value. While these changes resulted in a ¥667 million increase in beginning retained earnings, the impact on the current period's operating income was minimal. Looking ahead, Mixi revised its full-year forecast for the fiscal year ending March 31, 2022, providing a range of estimates that anticipate continued year-on-year declines. Net sales are projected between ¥105,000 million and ¥110,000 million, while operating income is expected to fall between 78.2% and 91.3% compared to the previous fiscal year. The company intends to maintain its annual dividend at ¥110.00 per share.
mixiNov 2021
Financial
Consolidated Financial Results for the Nine Months Ended December 31, 2022
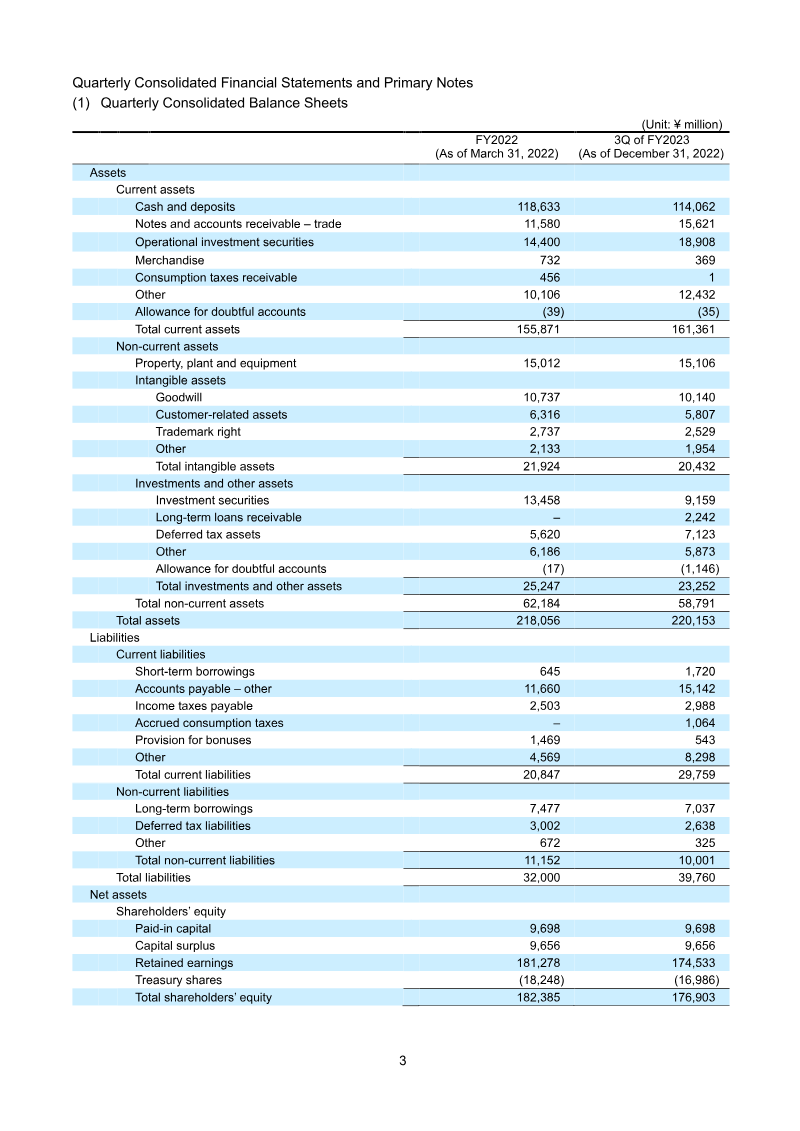
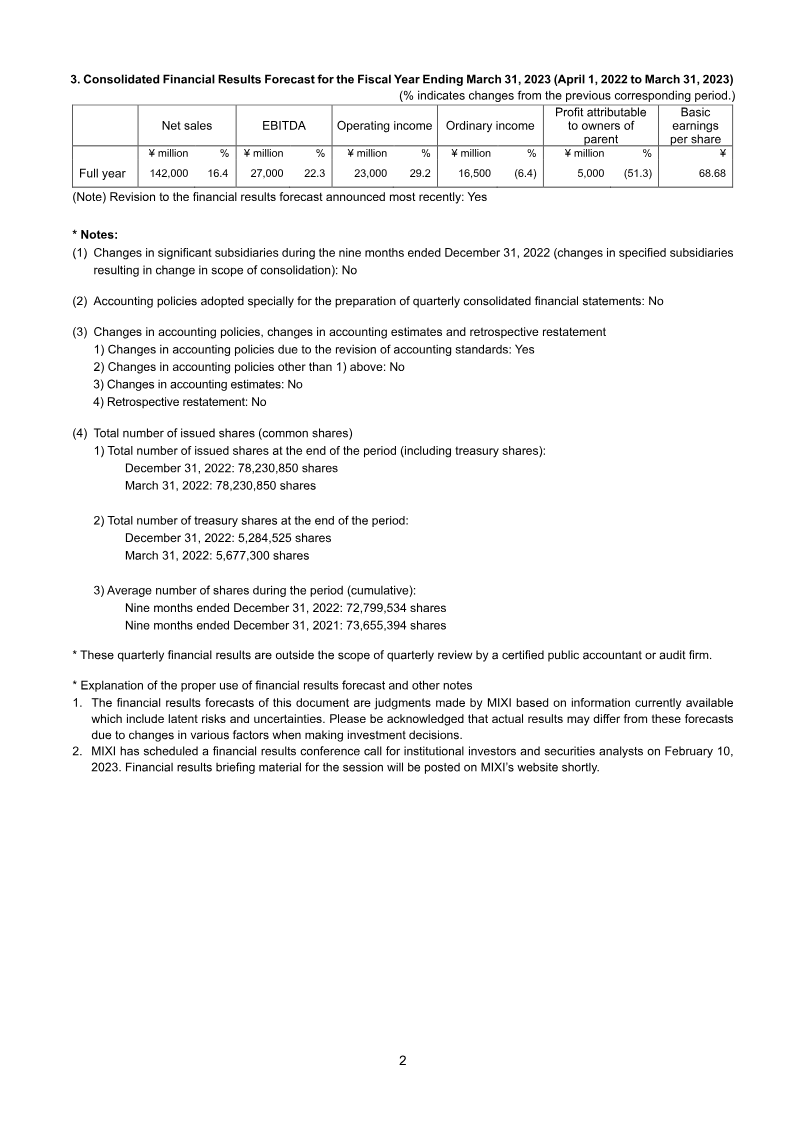
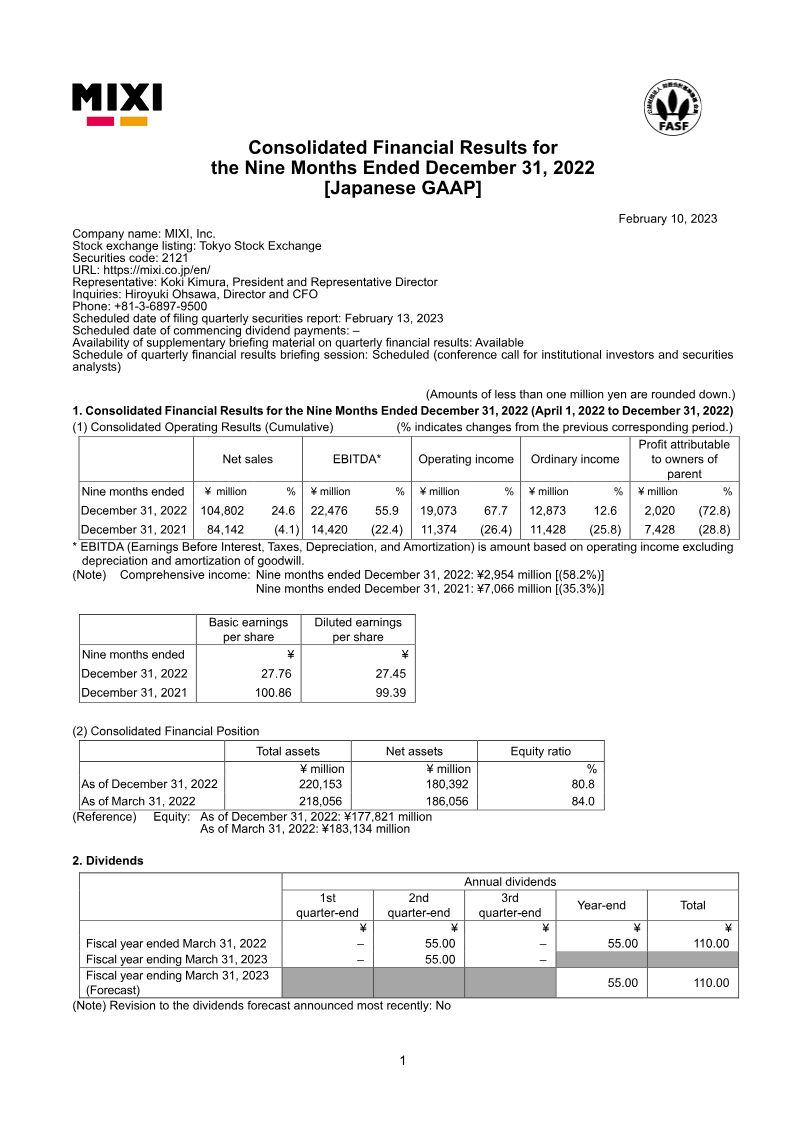
This financial report details the consolidated results for MIXI, Inc. during the first nine months of the fiscal year ending March 31, 2023. The company reported net sales of ¥104,802 million, representing a 24.6% increase over the previous year, and a 67.7% rise in operating income to ¥19,073 million. Despite these gains, profit attributable to owners of the parent fell by 72.8% to ¥2,020 million. This decline was primarily driven by significant non-operating and extraordinary losses, including a ¥4,818 million impairment loss related to the equity-method associate bitbank, inc., and a ¥4,468 million loss stemming from the withdrawal from certain new product developments. The scope of the report covers the company’s four primary business segments: Digital Entertainment, Sports, Lifestyle, and the newly established Investment Business. Digital Entertainment remains the primary revenue driver, largely fueled by the performance of the mobile game Monster Strike, contributing ¥73,457 million in net sales and ¥31,806 million in segment profit. The Sports and Lifestyle segments also saw revenue growth, though the Sports segment continued to operate at a loss. The Investment Business was officially designated as a main line of business during this period, leading to a reclassification of investment-related income and assets. Methodologically, the results are prepared under Japanese GAAP and include consolidated balance sheets, statements of income, and cash flow analysis. The company revised its full-year forecast, projecting net sales of ¥142,000 million and a 51.3% decrease in annual profit attributable to owners of the parent compared to the prior year. MIXI maintains a strong equity ratio of 80.8% and continues to distribute an annual dividend of ¥110 per share.
MIXI, Inc.Feb 2023
Financial
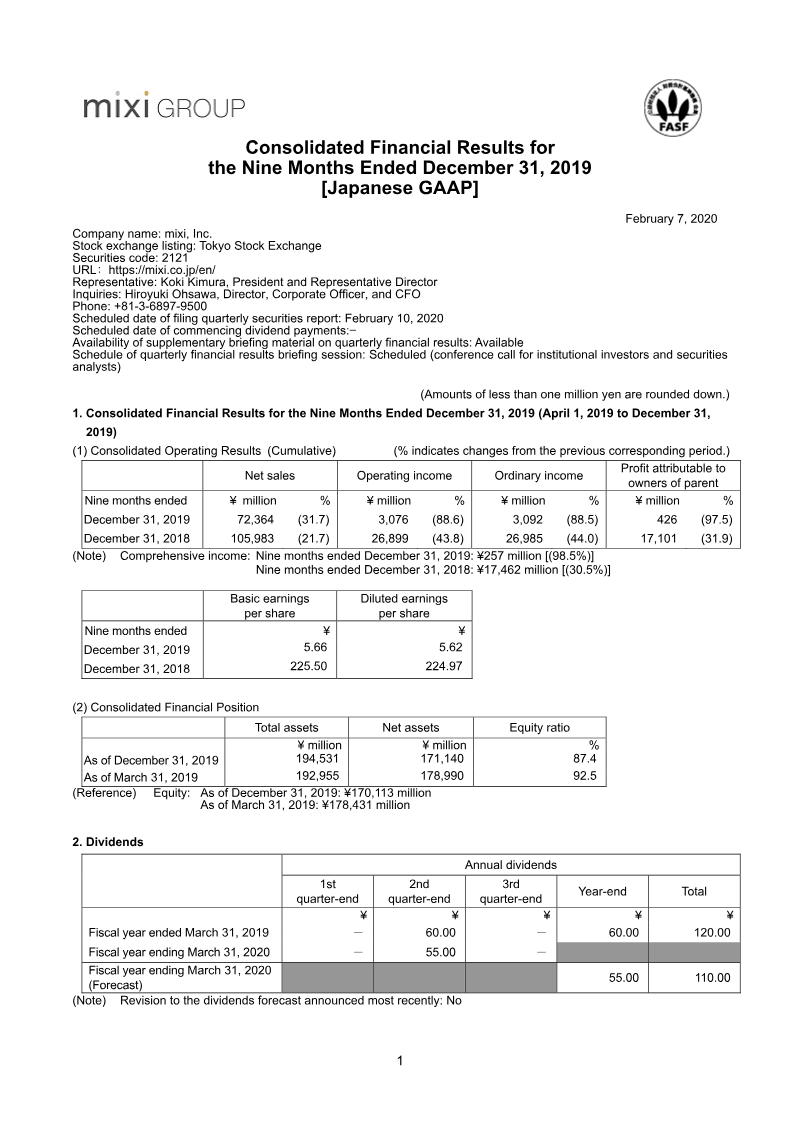
Consolidated Financial Results for the Nine Months Ended December 31, 2019
Mixi, Inc. reported a significant downturn in financial performance for the nine months ended December 31, 2019, characterized by a sharp contraction in both revenue and profitability. Net sales fell 31.7% year-over-year to ¥72,364 million, while operating income plummeted 88.6% to ¥3,076 million. Profit attributable to owners of the parent saw the most drastic decline, falling 97.5% to just ¥426 million. These results reflect a challenging period for the company’s core segments, particularly the Entertainment Business, where segment profit dropped from ¥34,297 million to ¥13,267 million. The geographic scope of these results is centered on Japan, covering the first three quarters of the 2019 fiscal year. The data highlights a transition in corporate strategy, as the company aggressively pursued acquisitions to diversify its portfolio into the sports and sports betting industries. Key transactions during this period included the acquisition of Chiba Jets Funabashi Inc., a professional basketball team, for ¥1,019 million, and Net Dreamers Co., Ltd., a sports media operator, for ¥15,000 million. These moves contributed to a substantial increase in goodwill, which rose to ¥18,481 million by the end of the period. Despite the current earnings pressure, the company maintains a strong consolidated financial position with total assets of ¥194,531 million and an equity ratio of 87.4%. Cash and deposits remained substantial at ¥124,196 million, though this was a decrease from the previous year-end due to investment activities and dividend payments. Looking ahead, the full-year forecast was revised downward, with net sales expected to reach ¥103,000 million and profit attributable to owners of the parent projected at ¥4,000 million, representing an 84.9% decrease from the prior fiscal year.
mixiFeb 2020
Financial
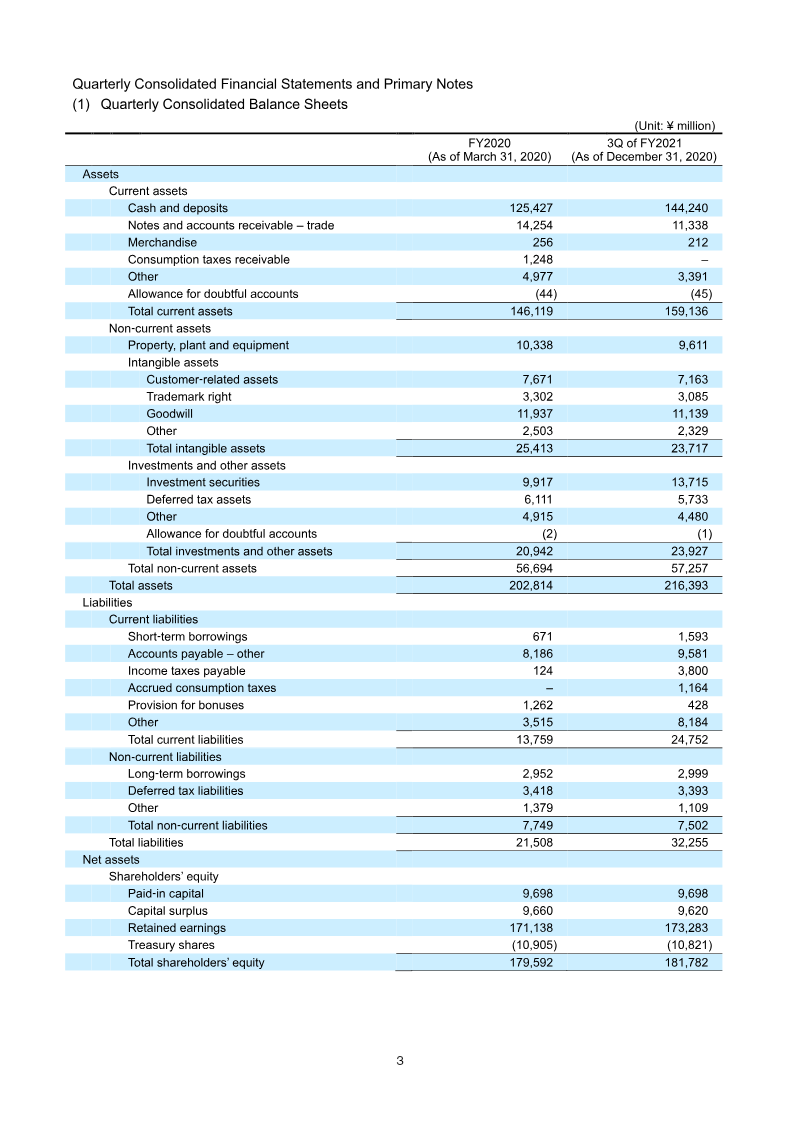
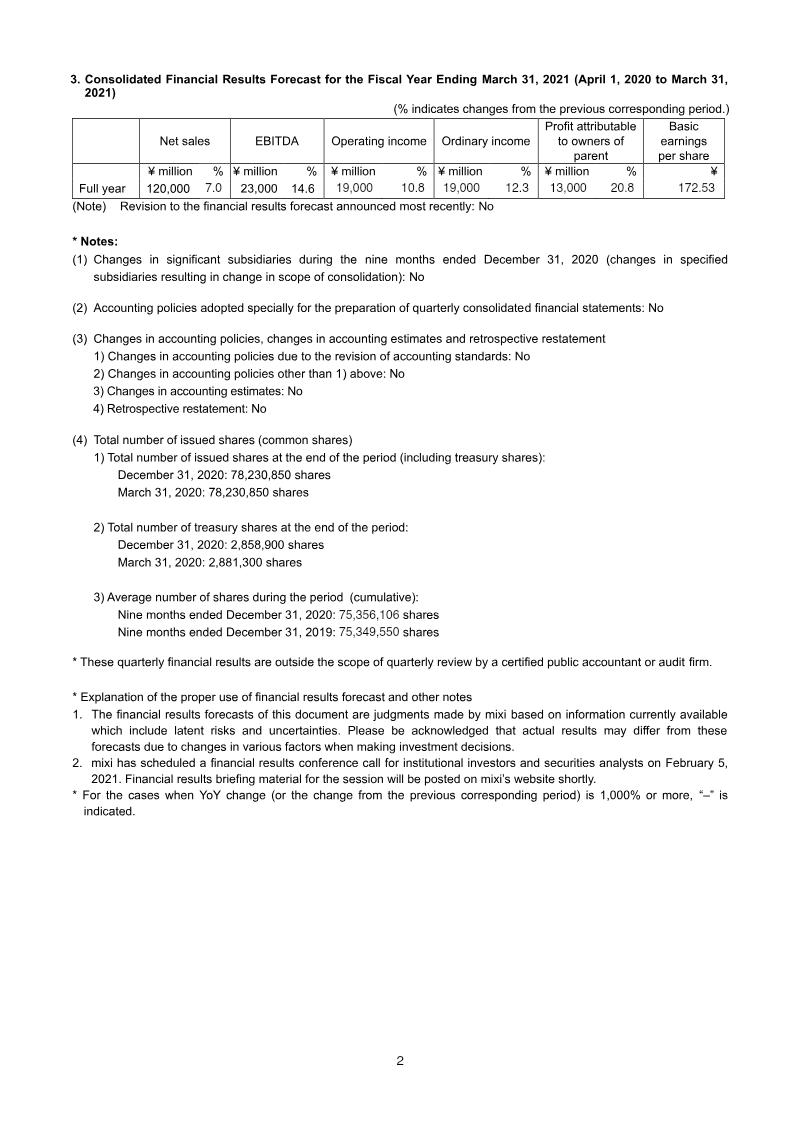
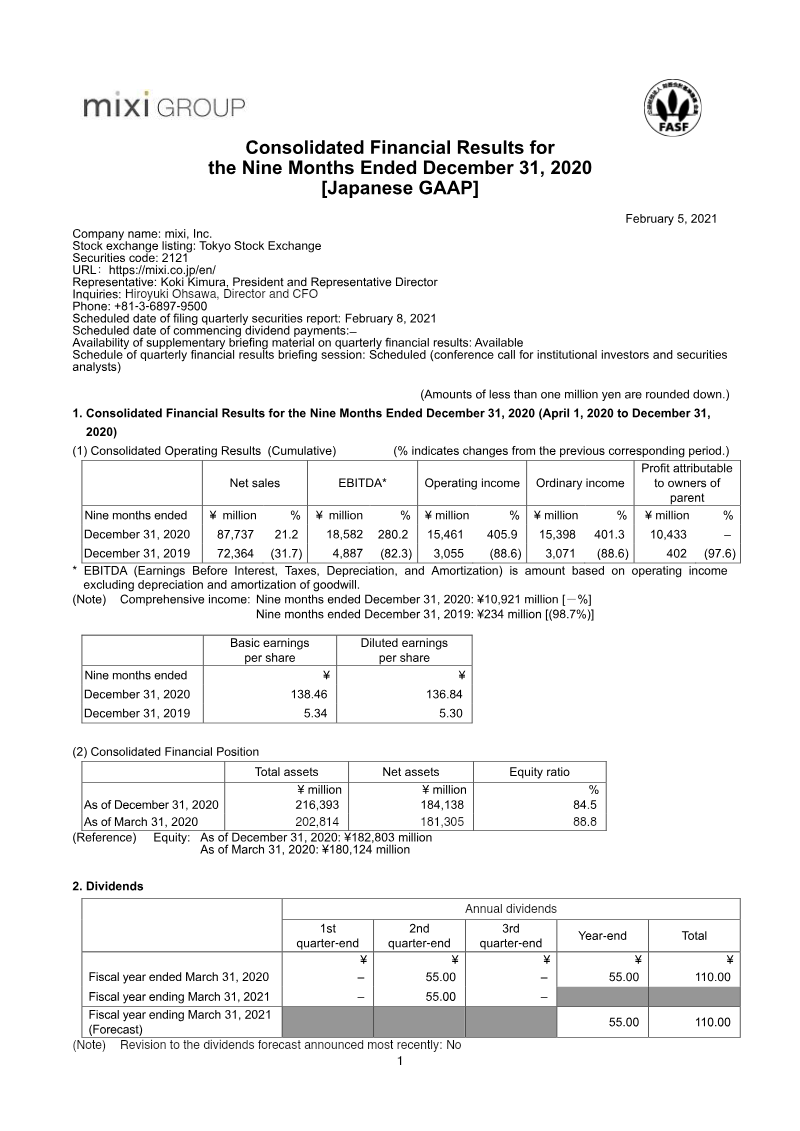
Consolidated Financial Results for the Nine Months Ended December 31, 2020
Mixi, Inc. reported significant growth in its consolidated financial results for the first nine months of the fiscal year ending March 31, 2021. Net sales reached ¥87,737 million, a 21.2% increase over the same period in the previous year. Profitability saw a substantial recovery, with operating income rising 405.9% to ¥15,461 million and profit attributable to owners of the parent reaching ¥10,433 million, compared to just ¥402 million in the prior year. This performance was driven largely by the Digital Entertainment Business, which generated ¥74,027 million in sales and ¥31,731 million in segment profit. The company restructured its reporting segments during this period to reflect its evolving portfolio, now categorizing operations into Digital Entertainment, Sports, and Lifestyle businesses. While Digital Entertainment remains the primary profit driver, the Sports Business saw a significant revenue increase to ¥8,866 million, though it recorded a segment loss of ¥4,448 million. The Lifestyle Business neared break-even with a minor loss of ¥22 million on sales of ¥4,843 million. Financial stability remains high, with an equity ratio of 84.5% and cash and deposits increasing to ¥144,240 million. The results also reflect the finalization of provisional accounting for the acquisitions of Chiba Jets Funabashi Co., Ltd. and Net Dreamers Co., Ltd. These adjustments led to a significant reallocation of acquisition costs from goodwill to customer-related intangible assets. Looking forward, the full-year forecast anticipates net sales of ¥120,000 million and a profit of ¥13,000 million. The company maintained its annual dividend forecast at ¥110 per share, signaling confidence in its cash flow and long-term financial position despite the inherent volatility of the entertainment sector.
mixiFeb 2021