Financialmixi
Consolidated Financial Results for the Three Months Ended June 30, 2022
1 Aug 202211 pages~19 min full read
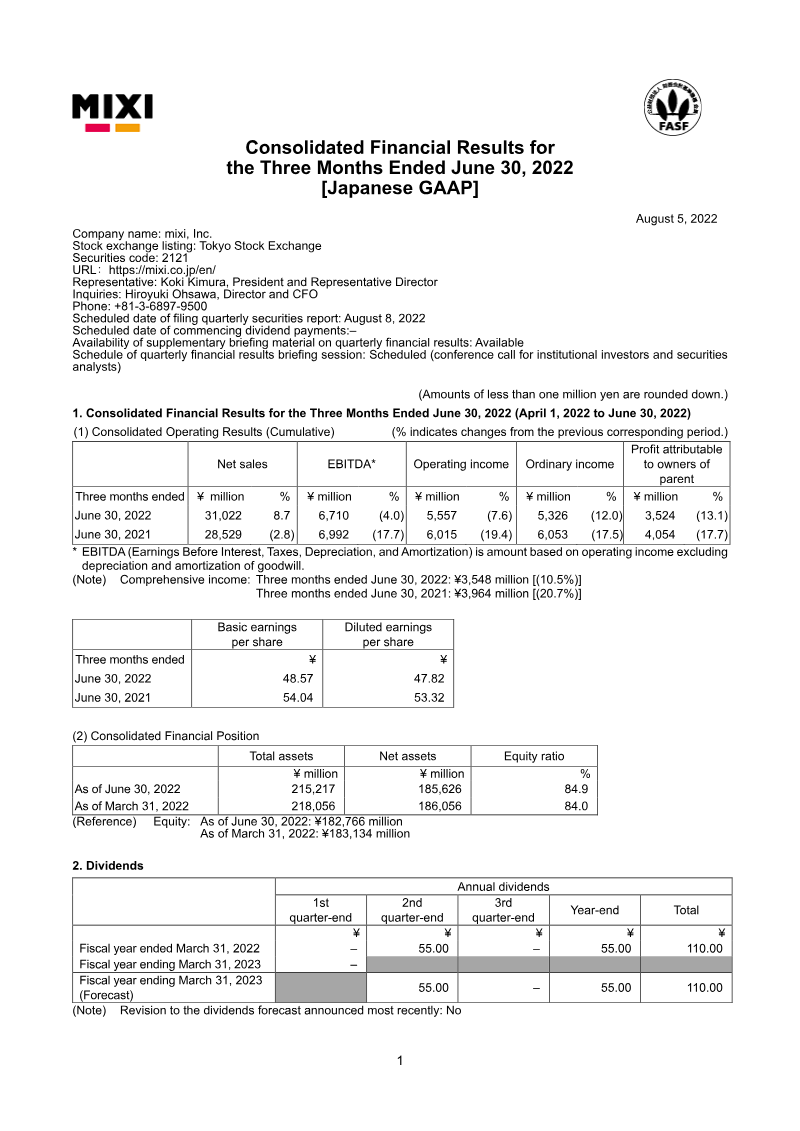
Mixi reported Q1 FY2023 net sales of ¥31,022 million, an 8.7% year-over-year increase driven by the Digital Entertainment segment and Monster Strike.
Profitability declined during the quarter, with operating income falling 7.6% to ¥5,557 million and profit attributable to owners of the parent dropping 13.1% to ¥3,524 million due to rising costs.
The Digital Entertainment segment remains the primary profit driver at ¥10,750 million, while the Sports and Lifestyle segments operated at losses of ¥653 million and ¥173 million, respectively.
Mixi maintained its full-year forecast of ¥120,000 million in net sales, despite projecting a 51.3% year-over-year decline in annual profit to ¥5,000 million.
The company established a new Investment Business segment, which contributed ¥179 million in profit and involved the reclassification of ¥14,400 million in investment securities to current assets.
Mixi maintains a strong balance sheet with total assets of ¥215,217 million and an equity ratio of 84.9%.
The company confirmed a planned annual dividend of ¥110.00 per share and the issuance of new stock options to directors in July 2022.
Mixi, Inc. reported consolidated financial results for the first quarter of the fiscal year ending March 31, 2023, covering the period from April 1 to June 30, 2022. The data reveals a period of revenue growth alongside declining profitability. Net sales rose 8.7% year-over-year to ¥31,022 million, primarily driven by the Digital Entertainment segment and its flagship title, Monster Strike. However, operating income fell 7.6% to ¥5,557 million, and profit attributable to owners of the parent decreased 13.1% to ¥3,524 million. This contraction in earnings is attributed to increased cost of sales and higher selling, general, and administrative expenses.
The company’s operations are divided into four reportable segments: Digital Entertainment, Sports, Lifestyle, and the newly established Investment Business. Digital Entertainment remains the primary profit driver, contributing ¥10,750 million in segment profit. In contrast, the Sports and Lifestyle segments reported losses of ¥653 million and ¥173 million, respectively. The Investment Business, elevated to a main line of business this quarter, contributed ¥179 million in profit. This structural change led to a reclassification of assets, with ¥14,400 million in investment securities moved to current assets as operational investment securities.
Geographically focused on the Japanese market, the company maintains a strong financial position with total assets of ¥215,217 million and an equity ratio of 84.9%. Despite the quarterly decline in profit, Mixi maintained its full-year forecast, projecting net sales of ¥120,000 million and a significant 51.3% year-over-year drop in annual profit to ¥5,000 million. The company also confirmed a planned annual dividend of ¥110.00 per share and noted the issuance of new stock options to directors in July 2022.