ReportAkatsuki
Consolidated Financial Statements: Q1 Fiscal Year 2026 (Japan)
11 pages~21 min full read
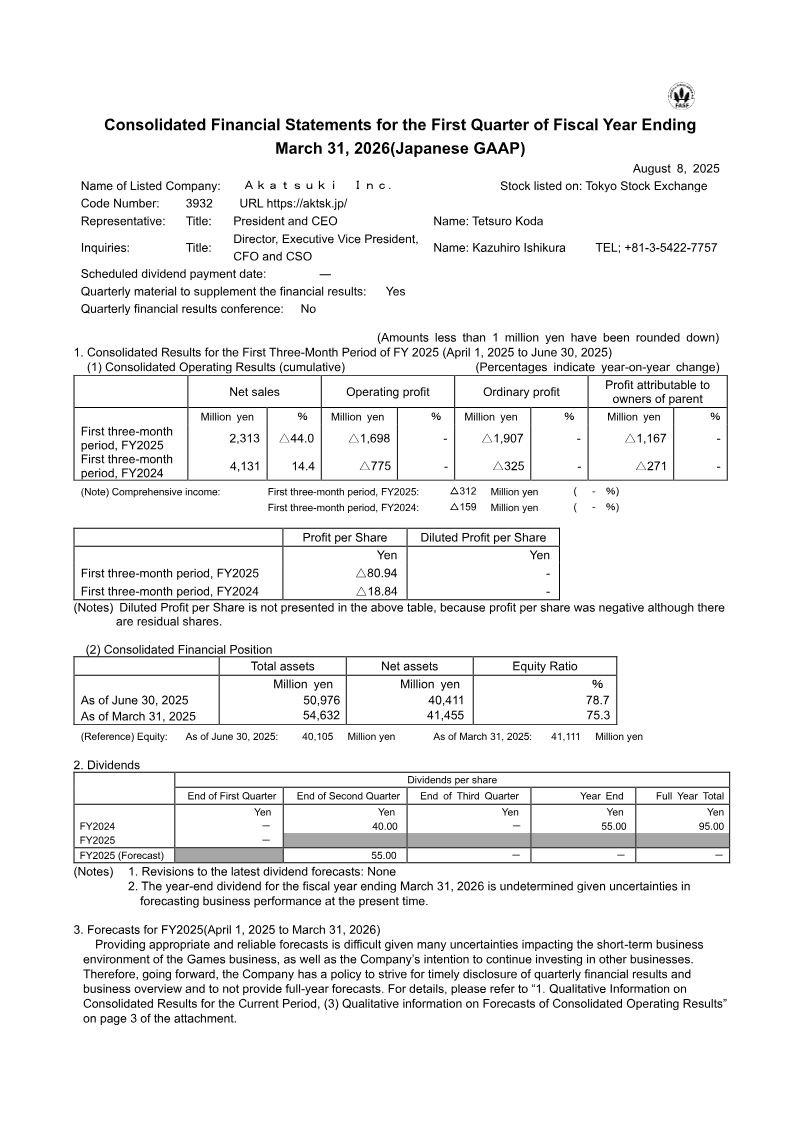
Akatsuki Inc. experienced a sharp financial downturn in Q1 FY2025, with net sales falling 44% year-over-year to ¥2,313 million and operating losses widening to ¥1,698 million.
See it on page 1The core Games unit was the primary driver of the deficit, suffering a 52.3% decline in sales and recording an operating loss of ¥1,643 million.
See it on page 4Net loss attributable to parent shareholders increased significantly to ¥1,167 million, compared to a ¥271 million loss in the same period last year.
See it on page 8The IP Solutions unit emerged as a growth driver, increasing sales by 167% and generating a ¥122 million profit, largely due to the inclusion of subsidiary CRAYON, Inc.
See it on page 5The Comics unit remained marginally profitable at ¥20 million, despite an 18.3% decline in segment sales.
See it on page 10While total assets decreased by ¥3,656 million to ¥50,976 million, the company’s consolidated equity ratio improved to 78.7%.
See it on page 6Management has declined to provide full-year forecasts for FY2026, citing market volatility and uncertainty in the gaming and investment sectors.
See it on page 5Akatsuki Inc. reports a first‑quarter fiscal 2025 performance that reflects a sharp contraction in its core gaming and comics businesses amid a challenging macro‑environment. Net sales fell 44 % YoY to ¥2,313 million, while operating loss widened to ¥1,698 million from a prior‑year loss of ¥775 million. The company’s consolidated equity ratio improved to 78.7 % from 75.3 %, but total assets declined by ¥3,656 million to ¥50,976 million. Net loss attributable to parent shareholders reached ¥1,167 million, a significant increase from the prior‑year loss of ¥271 million. Comprehensive income deteriorated to ¥312 million in losses versus ¥159 million previously.
Segment analysis shows the Games unit suffered a 52.3 % sales decline and an operating loss of ¥1,643 million; the Comics unit posted a modest profit of ¥20 million after an 18.3 % sales drop; the newly standalone IP Solutions unit grew sales by 167 % and generated a ¥122 million profit, largely driven by the inclusion of subsidiary CRAYON, Inc. The Others segment recorded a small profit after an 80.9 % sales increase.
Geographically, the report focuses on Japan with no disclosed overseas revenue breakdown. Methodologically, figures are based on Japanese GAAP quarterly consolidation; no full‑year forecasts are provided due to market uncertainty. The company maintains a policy of timely quarterly disclosure while withholding FY2026 forecasts, citing volatile gaming and investment conditions.