Marketing
Reports in the Marketing category.
40 documents
Report13 pages
Mobile Game Video Ads Analysis: Optimal Video Lengths and End Cards
This analysis examines the relationship between video ad length, end card formats, and campaign performance across five major mobile gaming genres: Hyper-Casual, RPG, Strategy, Puzzle, and Social Casino. By evaluating 3.7 billion in-app video ad impressions and subsequent installs via the Vungle platform, the study establishes creative benchmarks using a proprietary Power Index to measure efficacy. The findings suggest that as the industry moves toward a post-IDFA environment with limited user-level data, marketers must prioritize creative optimization and mass-appeal strategies to drive engagement.
The data reveals distinct audience preferences for each genre. Social Casino players favor efficiency, responding best to 10-second ads paired with standard static end cards. Puzzle and Strategy games both see peak performance when utilizing app store end cards that provide a direct path to download, though their optimal video lengths differ at 22 seconds and 33 seconds, respectively. Conversely, genres with deeper gameplay loops require more extensive creative storytelling. Hyper-Casual games perform best with 37-second ads and video end cards, while RPGs benefit from the longest engagement times, peaking at 46 seconds with looping video end cards to showcase aesthetic and narrative depth.
The scope of the research covers a global audience of over one billion unique devices, focusing on the structural elements of ad creatives rather than specific visual content. The methodology filters out low-performing impressions to ensure the Power Index accurately reflects the most successful format pairings. Ultimately, the findings conclude that aligning ad duration and post-roll interactive elements with genre-specific player expectations is essential for maximizing return on ad spend in an increasingly competitive mobile marketplace.
- Optimal video ad length varies significantly by genre, ranging from 10 seconds for Social Casino to 46 seconds for RPGs.
- Hyper-Casual games achieve peak performance with 37-second ads paired with video end cards.
- Strategy games perform best with 33-second ads, while Puzzle games reach peak efficacy at 22 seconds; both benefit most from app store end cards.
- Social Casino players prefer short, efficient 10-second ads combined with standard static end cards.
- RPGs require the longest engagement times at 46 seconds, utilizing looping video end cards to highlight narrative and aesthetic depth.
+2
LiftoffJan 2021
Report8 pages
Post-IDFA Mobile Game Advertising Costs: Casual vs Core
The analysis quantifies how Apple’s post‑IDFA privacy updates have reshaped user‑acquisition economics for mobile games, contrasting casual titles with core experiences. By aggregating 13.5 billion programmatic ad impressions from iOS and Android between January 1 2021 and September 30 2021, the study tracks cost‑per‑install (CPI) trends across three intervals—pre‑iOS 14.5, during the iOS 14.5‑14.6 rollout, and post‑iOS 14.6—using Moloco’s proprietary game taxonomy to separate titles into casual and core categories.
Casual games experienced a sharp decline in iOS CPI, falling 38 % after the iOS 14.6 release, while Android CPI for the same segment rose modestly by 16 %. In contrast, core games saw iOS CPI surge 78 % and Android CPI increase 36 % over the same period, reflecting intensified competition for a shrinking pool of high‑value, trackable users. The narrowing of the historical iOS‑Android CPI gap for casual titles indicates that Android installs now command comparable monetary value, whereas iOS remains the premium channel for core audiences due to higher in‑app‑purchase conversion rates.
Methodologically, the research averages weekly CPI data across the defined date ranges, applying a taxonomy that classifies games by genre and engagement depth, with subcategories overlapping between casual and core groups. Findings suggest that the divergent CPI trajectories are driven by user churn characteristics and lifetime‑value differentials rather than seasonal factors.
Strategic recommendations emphasize diversifying media spend, allocating budget to campaigns optimized for return‑on‑ad‑spend, and leveraging machine‑learning‑based bidding to mitigate volatility. These practices aim to preserve profitability amid the evolving privacy‑driven market dynamics for both casual and core mobile game publishers.
- Core games experienced a 78% surge in iOS CPI following the iOS 14.6 release, driven by intensified competition for a shrinking pool of high-value, trackable users.
- Casual games saw a 38% decline in iOS CPI post-iOS 14.6, while Android CPI for the same segment rose by 16%.
- Android CPI for core games increased by 36% during the same period, reflecting broader market volatility across platforms.
- The historical CPI gap between iOS and Android has narrowed for casual titles, suggesting that Android installs now provide monetary value comparable to iOS for that segment.
- iOS remains the premium channel for core games due to higher in-app purchase conversion rates, despite the significant cost increases.
+2
MolocoJan 2021
Report27 pages
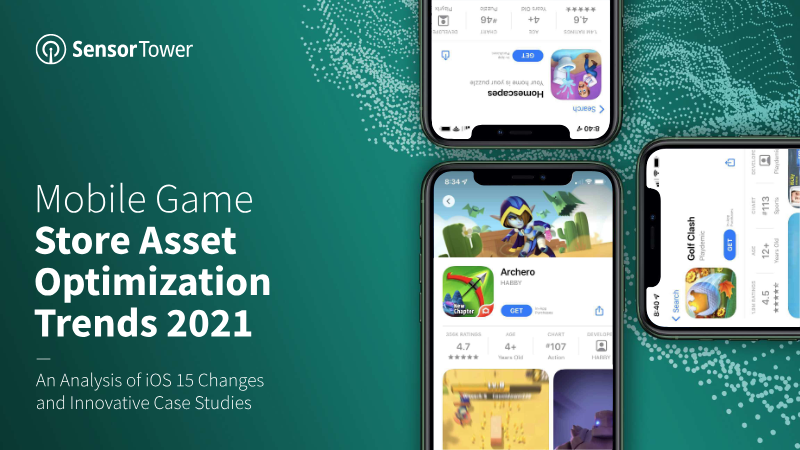
Mobile Game Store Asset Optimization Trends 2021
Strategic store asset optimization is a critical driver for increasing conversion rates and reducing user acquisition costs in the mobile gaming industry. Analysis of top-performing publishers reveals that the most successful entities treat app icons, screenshots, and product pages as dynamic marketing tools rather than static assets. This approach is particularly relevant following the release of iOS 15 in late 2021, which introduced Custom Product Pages and Product Page Optimization. These features allow developers to create up to 35 unique landing pages and conduct native A/B testing for up to 90 days, enabling highly targeted campaigns for specific audiences and influencers.
Data from major titles illustrates several dominant trends in asset management. Seasonal updates are a primary strategy; for instance, Golf Clash implemented 17 icon changes between 2017 and 2021 to reflect holidays like Halloween and St. Patrick’s Day. Other publishers, such as King and Garena, prioritize brand identity by integrating corporate logos across their entire portfolios to leverage existing brand equity. Furthermore, "forever franchises" like Animal Crossing: Pocket Camp use icon updates to signal anniversaries and live operations events, driving re-engagement among lapsed players.
A significant shift in the industry involves the alignment of store assets with high-performing ad creatives. Publishers like Playrix and Nexters successfully utilized "Pull the Pin" advertisements—which often differ from core gameplay—to lower costs per install. To minimize friction and improve conversion, these companies updated their App Store screenshots and icons to match the ad content. While such experimentation was historically more prevalent on Google Play due to its long-standing A/B testing tools, the new iOS 15 capabilities are expected to catalyze similar data-driven optimization strategies across the Apple ecosystem. This analysis utilizes Sensor Tower’s proprietary intelligence platforms to track these trends across global markets and major gaming segments.
- The release of iOS 15 in late 2021 introduced native A/B testing for up to 90 days and the ability to create 35 unique Custom Product Pages, enabling highly targeted audience acquisition.
- Top-performing publishers are aligning App Store screenshots and icons with high-performing ad creatives—such as Playrix and Nexters' 'Pull the Pin' ads—to reduce user acquisition costs and minimize conversion friction.
- Successful mobile game publishers treat store assets as dynamic marketing tools rather than static elements, frequently updating them to reflect seasonal events, anniversaries, and live operations.
- Strategic icon management is a proven re-engagement tactic, exemplified by Golf Clash, which implemented 17 distinct icon updates between 2017 and 2021 to capitalize on holiday-themed content.
- Major publishers like King and Garena leverage brand equity by integrating consistent corporate logos across their entire game portfolios to strengthen brand identity.
+2
Sensor TowerJan 2021
Report30 pages
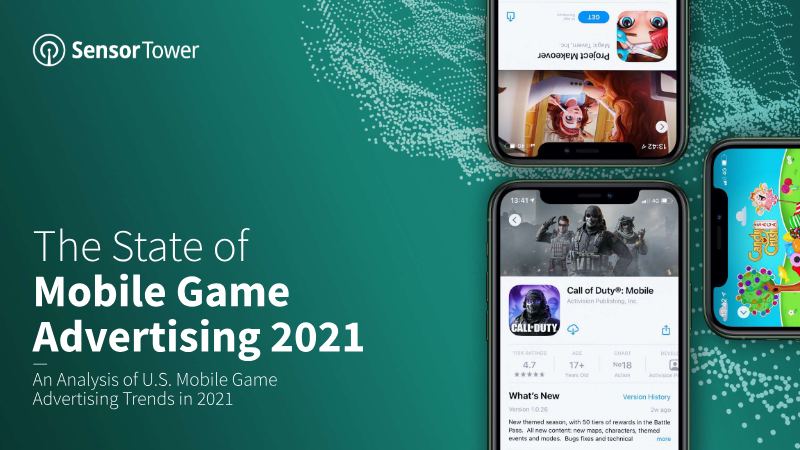
The State of Mobile Game Advertising: An Analysis of U.S. Mobile Game Advertising Trends in 2021
Mobile game advertising in the United States remained resilient through the first half of 2021, showing no immediate negative impact from privacy changes such as the deprecation of IDFA. Analysis of the advertising landscape reveals a strategic divide between ad networks. Specialized platforms like AppLovin, Chartboost, and Vungle maintain a high concentration of gaming content, often exceeding 90 percent share of voice. In contrast, diversified platforms like Facebook, TikTok, and YouTube maintain a more balanced split between gaming and non-gaming advertisements, serving as critical channels for reaching broader audiences.
Market trends indicate that ad network selection is increasingly driven by genre and demographic alignment. Puzzle and Hypercasual games dominate gaming-focused networks, while mid-core genres like Strategy and Shooter find higher engagement on social platforms like YouTube and Instagram. Notably, Adcolony emerged as a primary hub for Casino games, catering to an older, female-leaning demographic. Across most platforms, video remains the dominant creative format, though playable ads have gained significant traction, particularly on AppLovin where they account for over 40 percent of gaming share of voice.
Creative strategies are evolving to include "fake playables," relaxing music for casual titles, and real-world testimonial-style conversations. Even mid-core titles with complex mechanics, such as Call of Duty: Mobile, have begun adopting simplified playable "mini-games" to lower the barrier for user acquisition. This data, compiled by Sensor Tower using its Ad Intelligence platform, covers U.S. trends across iOS and Android from 2018 through the second quarter of 2021, suggesting that success in the current market requires a sophisticated mix of genre-specific network targeting and experimental creative formats.
- Mobile game advertising in the U.S. remained resilient through H1 2021, showing no immediate negative impact from the deprecation of IDFA.
- Playable ads have become a dominant creative format, accounting for over 40 percent of the gaming share of voice on AppLovin.
- Specialized ad networks like AppLovin, Chartboost, and Vungle maintain a gaming-focused inventory exceeding 90 percent share of voice, while platforms like Facebook, TikTok, and YouTube provide broader audience reach.
- Ad network selection is increasingly genre-specific, with Puzzle and Hypercasual games favoring gaming-focused networks, while Strategy and Shooter titles find higher engagement on social platforms like YouTube and Instagram.
- Adcolony has established itself as a primary hub for Casino games, effectively targeting an older, female-leaning demographic.
+1
Sensor TowerJan 2021