
East Side Games
East Side Games Group is a mobile game developer and publisher focused on free-to-play titles. It publishes quarterly and annual financial results, and its documents also include a game analytics report on retention.
Documents


East Side Games Group Q2 2025 Financial Results
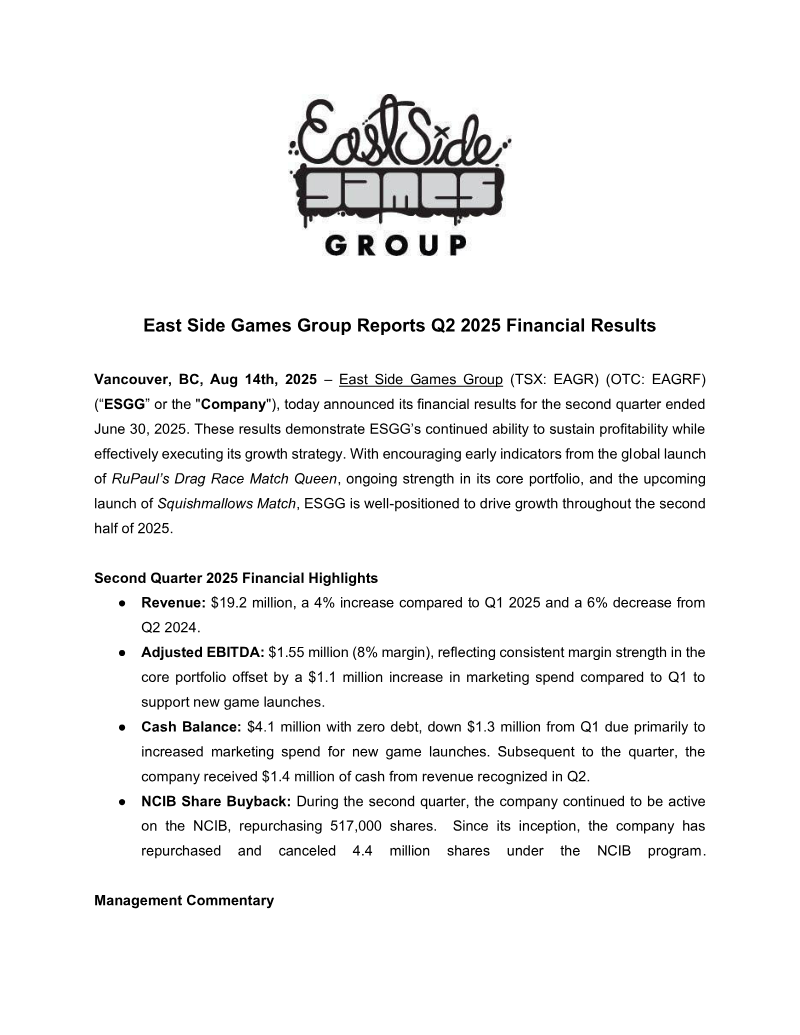
East Side Games Group (ESGG) reported its financial results for the second quarter ending June 30, 2025, emphasizing a strategy of reinvesting core portfolio profits into new game launches to drive long-term growth.
- East Side Games Group reported Q2 2025 revenue of $19.2 million, marking a 4% sequential increase but a 6% year-over-year decline.
- Adjusted EBITDA was $1.55 million with an 8% margin, suppressed by a $1.1 million increase in marketing spend for new title launches.
- The company maintains a debt-free balance sheet with $4.1 million in cash and continues to execute its NCIB program, having repurchased 4.4 million shares.


East Side Games Group Fourth Quarter and 2025 Annual Results
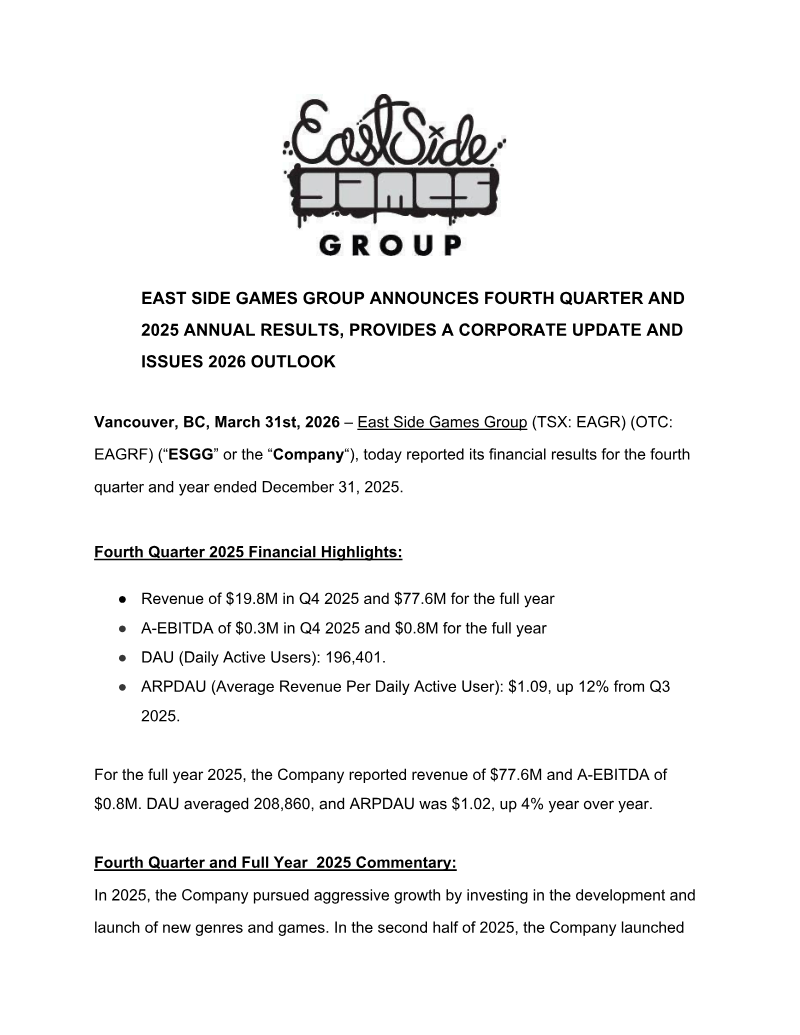
East Side Games Group reported its 2025 annual results, revealing a strategic pivot from aggressive growth to a focus on profitability, debt reduction, and operational efficiency.
- East Side Games Group reported 2025 annual revenue of $77.6 million with an adjusted EBITDA of $0.8 million, falling short of initial growth targets due to market saturation and high platform fees.
- The company is currently in breach of a financial covenant under its credit agreement and is seeking a waiver from its lender while managing $5.2 million in total debt.
- Management has initiated a restructuring plan to achieve $4 million in annualized savings through headcount reductions and the cancellation of underperforming capital projects.


Game Analytics 100: The Retention Curve
The analysis demonstrates that player retention in mobile games can be accurately modeled with a power-law curve, expressed either as \(r(n)=a\,b^n\) or \(r(n)=a\,n^{b}\).
- Mobile game retention follows a predictable power-law curve, modeled as r(n)=an^b, which allows analysts to forecast long-term player behavior using only day-1, day-3, and day-7 cohort data.
- Fitting retention curves enables precise lifetime value (LTV) projections; for example, an average revenue of $1.00 per daily active user results in an LTV90 of 7.65 and an LTV180 of 10.17.
- Analysts can derive the initial retention level (a) and decay exponent (b) by applying the LINEST function to logged cohort values in Excel, yielding representative curves such as r(n)=0.396n^-0.472.