Circana
Research8 documents
Documents
Article
The U.S. Video Game Market: July 2026
The U.S. video game market experienced a notable contraction in July 2026, with total consumer spending falling 10% year-over-year to $4.5 billion. This decline reflects a broader downward trend for the first seven months of the year, which currently tracks 2% behind 2025 levels. The market analysis, which utilizes a combination of projected estimates and actual sales data from Circana and mobile revenue insights from Sensor Tower, highlights significant weaknesses across all primary industry segments.
Content spending, which accounts for the bulk of the market at $4.1 billion, decreased by 9% compared to the previous year. While mobile content saw the most substantial drop, console and PC sectors also faced declines. Hardware performance was particularly weak, generating $282 million in revenue—a 29% year-over-year decrease and the lowest July total since 2020. Unit sales for hardware plummeted 39%, exacerbated by a 16% increase in the average price of new systems, which reached $542. Despite these challenges, the Nintendo Switch 2 continues to show resilience, maintaining a sales pace 11% ahead of the original Switch after 14 months on the market.
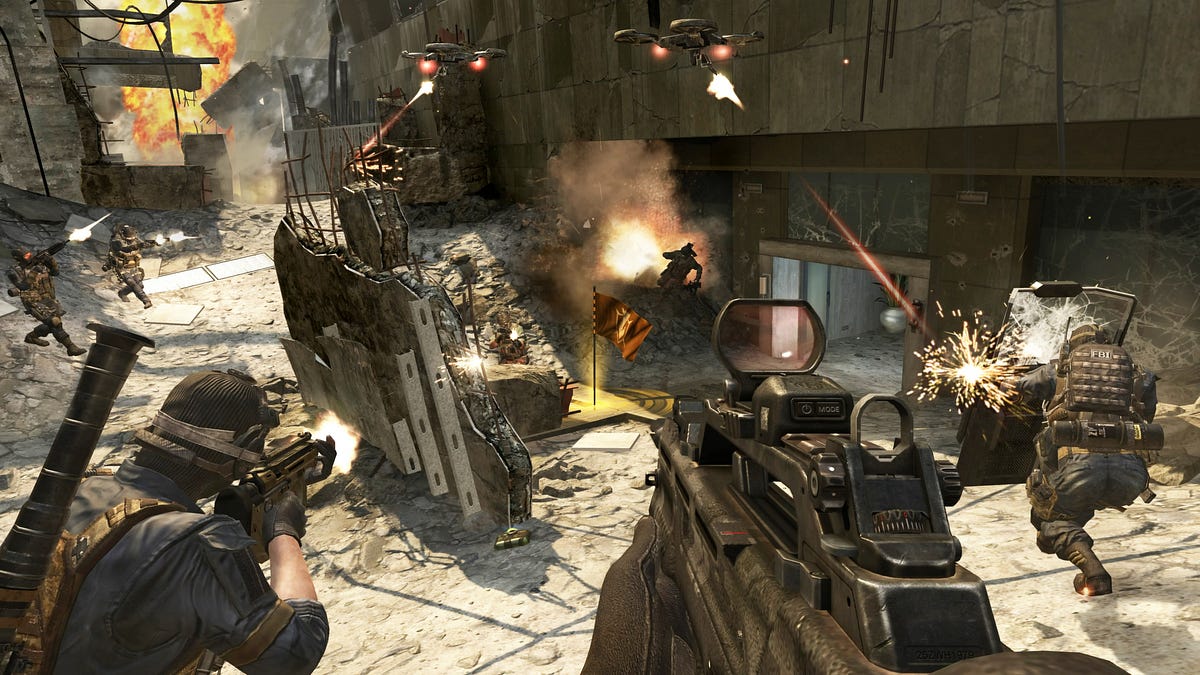
Accessories also struggled, recording $178 million in revenue, representing a 6% decline and the lowest July performance since 2019. On the software front, re-releases dominated the charts, with Call of Duty: Black Ops II and Call of Duty: Black Ops securing top positions following their arrival on PlayStation platforms. In the mobile sector, Pokémon GO saw a significant 230% revenue surge driven by its tenth-anniversary events, while other titles like Last War: Survival continued a multi-month decline attributed to reduced user acquisition efforts.
- U.S. video game spending fell 10% year-over-year in July 2026 to $4.5 billion, with the market currently tracking 2% behind 2025 levels through the first seven months of the year.
- Hardware spending dropped 29% year-over-year to $282 million, marking the worst July performance for the sector since 2020.
- Hardware unit sales declined 39% compared to July 2025, while the average price of a new system rose 16% to $542, contributing to the sales slump.
- Content spending totaled $4.1 billion in July, a 9% decrease year-over-year, with mobile content experiencing the sharpest decline alongside drops in console and PC segments.
- Call of Duty: Black Ops II was the best-selling game of July 2026, driven by its new PS4 and PS5 port, while EA Sports College Football 27 ranked as the second-best new release.
+2
CircanaAug 2026

Article
The U.S. Video Game Market: June 2026
The U.S. video game market experienced a significant contraction in June 2026, with total consumer spending reaching $4.5 billion, a 21% decline compared to the same period in 2025. This downturn is primarily attributed to a high base effect resulting from the record-breaking launch of the Nintendo Switch 2 in June 2025. Despite the monthly decline, total consumer spending for the first half of 2026 reached $27.5 billion, remaining nearly flat at just 1% behind the pace set in the previous year.
Hardware spending saw the most dramatic shift, falling 62% year-over-year to $383 million. While the Nintendo Switch 2 remained the market leader in both units sold and revenue for the month and the year-to-date, its hardware spending dropped 79% compared to its launch month. Conversely, the Xbox Series S|X demonstrated positive momentum, with unit sales increasing 86% year-over-year, marking Microsoft’s strongest console performance of 2026. Digital adoption continues to evolve, with disc-less models now accounting for 52% of all Xbox Series consoles sold, compared to 27% for PlayStation 5.
Content spending also faced headwinds, declining 12% to $3.9 billion, with mobile and console segments driving the majority of the loss. Subscriptions emerged as the only growth category, rising 7% year-over-year. In the software market, EA Sports UFC 6 secured the top-grossing position for June, while the year-to-date charts remained stable, led by titles such as Resident Evil: Requiem and Crimson Desert. The analysis utilizes a methodology incorporating both actual sales figures and projected estimates, with mobile data sourced from Sensor Tower to provide a comprehensive view of the U.S. gaming landscape.
- U.S. video game consumer spending fell 21% year-over-year to $4.5 billion in June 2026, primarily due to a high base effect from the Nintendo Switch 2 launch in June 2025.
- Hardware spending dropped 62% year-over-year to $383 million, with Nintendo Switch 2 revenue declining 79% and PlayStation 5 revenue slipping 19%.
- The Xbox Series S|X bucked the hardware trend with unit sales up 86% year-over-year, marking Microsoft's best console unit performance of 2026.
- Total U.S. consumer spending for the first half of 2026 reached $27.5 billion, remaining 1% behind the pace set in the first half of 2025.
- Subscriptions were the only growth segment in June 2026, rising 7% year-over-year, while all other categories including mobile and console content declined.
CircanaJul 2026
Article
The U.S. Gaming Market: May 2026
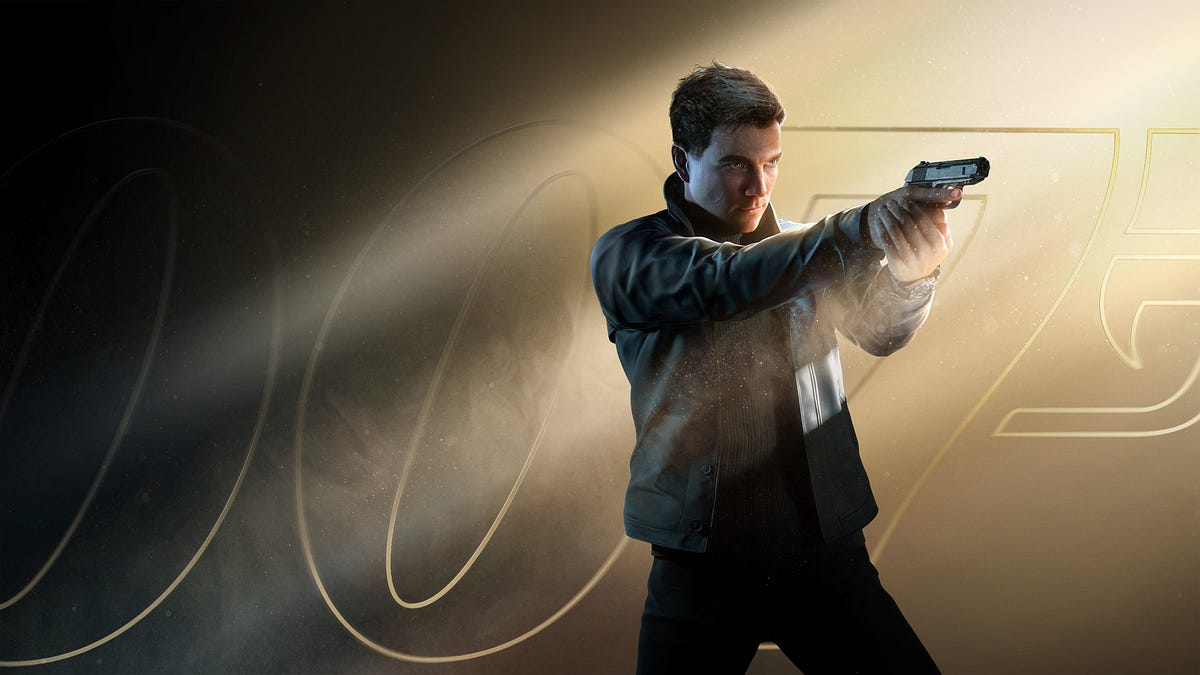
The May 2026 U.S. gaming market shows modest overall growth, with consumer spending reaching $4.2 billion—a 3 % year‑over‑year increase driven by the launch of “007 First Light” and the Nintendo Switch 2. Cumulative spending for the first five months rose 4 % to $23 billion, while content‑related purchases grew 1 % in May to $3.8 billion, totaling $20.4 billion year‑to‑date (3 % above 2025). Console content led the rise, up 25 % YoY; PC content and subscription services also expanded by 15 % and 11 %, respectively.
Hardware sales, however, faced pressure. Total hardware spending climbed 38 % YoY to $249 million, yet the PlayStation 5 experienced a 43 % decline in dollar sales and a 58 % drop in units after recent price hikes. The Nintendo Switch 2 offset this trend, becoming the top‑selling device in May and year‑to‑date with 5.9 million units sold, the second fastest launch in U.S. history after the Game Boy Advance. Xbox Series S|X spending increased 7 % YoY, though unit sales fell 12 %. Average hardware price rose to $502 (14 % YoY), with PlayStation 5 and Xbox Series prices up 33 % and 22 %, respectively. Accessories spending grew 8 % YoY to $168 million, driven by a 95 % surge in racing wheel sales following “Forza Horizon 6” launch.
Game sales data, sourced from Circana’s projected estimates, highlight “007 First Light” as May’s best‑selling title across platforms and “Forza Horizon 6” as the second best. Resident Evil: Requiem maintained first place in five‑month sales, while mobile revenue leaders remained consistent with titles such as “Monopoly GO!” and “Candy Crush Saga.” The report draws on Circana’s consumer‑purchase tracking, supplemented by Sensor Tower mobile revenue data.
- The U.S. video game market saw overall spending increase by 3% year-over-year in May 2026, reaching $4.2 billion, primarily driven by the new game 007 First Light and the Nintendo Switch 2. Year-to-date spending is up 4% to $23 billion.
- The Nintendo Switch 2 significantly boosted hardware sales, which climbed 38% year-over-year to $249 million in May, offsetting a 43% decline in PlayStation 5 dollar sales and a 58% drop in units. The Switch 2 was the top-selling console in both units and revenue for May and year-to-date.
- In its first year, the Nintendo Switch 2 sold 5.9 million units in the U.S., making it the second fastest-selling gaming device since 1995, only behind the Game Boy Advance (6.5 million units).
- Content spending grew 1% year-over-year to $3.8 billion in May, with console content leading the growth at 25% year-over-year. PC content and subscriptions also saw increases of 15% and 11% respectively.
- 007 First Light was the best-selling game in May and achieved the best launch for any James Bond game. Forza Horizon 6 was the second best-selling game of the month, leading sales on Xbox and PC.
+2
CircanaJun 2026

Article
The U.S. Gaming Market: April 2026
The April 2026 U.S. gaming market generated $4.256 billion in revenue, a 3 % year‑over‑year increase that places the first four months of 2026 five percent ahead of the same period in 2025. Content sales rose 2 % to $3.837 billion, while hardware revenue climbed 34 % to $261 million, driven largely by the Nintendo Switch 2’s strong performance. The Switch 2 led both unit and revenue sales in April, with the PlayStation 5 following; the original Switch, Xbox Series, and PlayStation 5 all saw double‑digit declines. Consumer spending on console games surged 21 % YoY, and subscription services grew 13 %. Physical game sales rebounded sharply, up 44 % YoY in April to $96 million and +9 % year‑to‑date.
Game titles shifted under Circana’s new methodology that blends digital and physical data. Tomodachi Life: Living the Dream topped April’s revenue chart with an estimated $41 million, followed by Pragmata and Crimson Desert. Resident Evil: Requiem, Crimson Desert, and MLB: The Show 26 remained the top year‑to‑date performers. Mobile titles such as MONOPOLY GO!, Royal Match, and Last War: Survival held steady positions, while Pixel Flow climbed to #13 in U.S. revenue.
The report draws on Circana’s proprietary sales data and projections, offering a detailed snapshot of consumer spending patterns across console, PC, and mobile segments in the United States for early 2026.
- The U.S. gaming market generated $4.256 billion in April 2026, marking a 3% year-over-year increase and keeping the year-to-date performance 5% ahead of 2025.
- Hardware revenue surged 34% to $261 million, primarily driven by the strong launch performance of the Nintendo Switch 2, which led both unit and revenue sales for the month.
- Physical game sales experienced a significant rebound, rising 44% year-over-year in April to $96 million, contributing to a 9% year-to-date increase.
- Consumer spending on console games grew by 21% year-over-year, while subscription services saw a 13% increase in revenue.
- Legacy hardware including the original Nintendo Switch, Xbox Series, and PlayStation 5 all experienced double-digit revenue declines in April.
+2
CircanaMay 2026
Article
Circana: The U.S. Gaming Market in February 2026
The United States gaming market experienced modest growth in February 2026, with total consumer spending reaching $4.557 billion, a 1% increase compared to the same period in 2025. While game content spending remained flat at $4.016 billion, this segment was bolstered by a 27% year-over-year surge in subscription revenue, which helped offset other market fluctuations.
Hardware sales served as a primary driver of growth, rising 22% to $326 million. This performance was fueled entirely by the Nintendo Switch 2, which continues to demonstrate strong momentum nine months into its lifecycle. Sales for the Switch 2 are currently running 45% ahead of the original Nintendo Switch’s performance during its comparable launch window. Conversely, legacy hardware struggled, with PlayStation 5 sales declining 10%, Xbox Series consoles dropping 32%, and the original Nintendo Switch falling 69% year-over-year. Despite these declines, the PlayStation 5 remained the top-selling system by both units and revenue, followed by the Switch 2.
Software performance was highlighted by the successful launch of Resident Evil: Requiem, which claimed the top spot on the sales charts despite being available for only three days during the month. Its launch performance significantly outperformed Resident Evil: Village, showing a 60% increase in dollar terms and a 40% increase in unit sales. Other notable software activity included the strong debut of Dragon Quest VII: Reimagined and a significant surge for Diablo II: Resurrected, which climbed to the 13th position following the release of the Infernal Edition on Steam. In the mobile sector, Monopoly GO! maintained its lead, while Pokémon GO saw a 61% month-over-month revenue increase, returning to the top ten. Accessories experienced a slight contraction, falling 2% to $215 million, with the PlayStation Portal emerging as the top-selling accessory by revenue.
- The U.S. gaming market grew 1% year-over-year in February 2026 to $4.557 billion, supported by a 27% surge in subscription revenue that offset flat content spending.
- Hardware spending rose 22% to $326 million, driven by the Nintendo Switch 2, which is currently tracking 45% ahead of the original Switch’s performance during its comparable launch window.
- Legacy console sales saw significant declines, with Xbox Series consoles dropping 32%, the original Nintendo Switch falling 69%, and the PlayStation 5 decreasing 10%.
- Despite overall hardware declines, the PlayStation 5 remained the top-selling system by both units and revenue, followed by the Nintendo Switch 2.
- Resident Evil: Requiem debuted as the top-selling game, outperforming Resident Evil: Village by 60% in dollar sales and 40% in unit sales despite only three days of availability.
+2
CircanaMar 2026
Article
The US Gaming Market: January 2026
The United States gaming market experienced a positive start to 2026, with total consumer spending reaching $4.698 billion in January, representing a 3% increase compared to the same period in 2025. This growth was primarily driven by a 3% rise in game sales, which totaled $4.266 billion, and a significant 16% surge in hardware spending, which reached $248 million. Within the content sector, subscription services emerged as a major growth engine, posting a 23% year-over-year increase.
Hardware performance was characterized by a sharp divergence between legacy and new systems. While the overall hardware category grew, this expansion was driven entirely by the Nintendo Switch 2. Conversely, sales for the PlayStation 5 and Xbox Series S|X declined by 17% and 27%, respectively, while the original Nintendo Switch saw a 79% collapse in sales. Despite these declines, the PlayStation 5 remained the market leader in both unit volume and total revenue for the month. Meanwhile, the accessories segment faced a slight downturn, falling 5% to $185 million, marking its lowest January performance since 2020.
Market engagement remained concentrated among established franchises, with Call of Duty: Black Ops 7, NBA 2K26, and Madden NFL 26 leading the sales charts. New releases struggled to gain significant traction, with Code Vein II being the only new title to enter the top 20, though it achieved the number one spot on PC. Notable shifts in consumer interest were observed in older titles, such as Fallout 4, which re-entered the top 20 following the success of its television adaptation, and Final Fantasy VII: Remake Intergrade, which saw a massive surge in rankings following its release on new hardware platforms.
- The US gaming market grew 3% year-over-year in January 2026, reaching $4.698 billion in total consumer spending.
- Hardware spending surged 16% to $248 million, driven entirely by the launch of the Nintendo Switch 2, while PlayStation 5 and Xbox Series S|X sales declined by 17% and 27% respectively.
- Subscription services were a primary growth driver for content, posting a 23% year-over-year increase within the $4.266 billion game sales total.
- Despite a 79% collapse in sales for the original Nintendo Switch and declines in other major consoles, the PlayStation 5 remained the market leader in both unit volume and total revenue.
- Market engagement remains heavily concentrated in established franchises like Call of Duty: Black Ops 7, NBA 2K26, and Madden NFL 26, with few new releases gaining traction.
+2
CircanaFeb 2026

Article
Circana: The US Gaming Market Could Hit an All-Time High in 2026
The United States video game market is projected to reach a nominal all-time high of $62.8 billion in 2026, representing a 3% year-over-year increase. This follows a 2025 performance where consumer spending on hardware, content, and accessories reached $60.7 billion, a 1.4% growth over the previous year. While these figures suggest a record-breaking trajectory, analysts emphasize that when adjusted for inflation, the market remains below the real-terms peak established in 2021.
Growth in 2026 is expected to be driven by several key factors, including the continued success of the Nintendo Switch 2, which has emerged as the fastest-selling home console in domestic history. Additionally, high consumer anticipation for the release of Grand Theft Auto VI is expected to stimulate significant demand across hardware, accessories, and subscription services. A robust slate of major software releases, such as Marvel’s Wolverine and new entries in the Resident Evil and Pokémon franchises, further supports this positive outlook.
Despite these growth drivers, the industry faces notable headwinds. Rising costs for essential hardware components like GPUs, CPUs, and RAM—partially due to competition with AI data centers—threaten to increase consumer prices. Market sensitivity to these costs is high; research indicates that a significant portion of the player base would respond to price hikes by delaying full-price purchases, waiting for sales, or shifting engagement toward free-to-play titles. Furthermore, younger demographics are increasingly gravitating toward PC and mobile platforms, a trend that could be accelerated if traditional console hardware becomes less accessible.
- The US video game market is projected to reach a nominal record of $62.8 billion in 2026, a 3% year-over-year increase following a $60.7 billion performance in 2025.
- Despite nominal growth, the market remains below its 2021 real-terms peak when adjusted for inflation.
- Market growth in 2026 is expected to be driven by the launch of the Nintendo Switch 2 and the release of Grand Theft Auto VI, alongside major titles like Marvel’s Wolverine and new entries in the Resident Evil and Pokémon franchises.
- Rising costs for hardware components, such as GPUs, CPUs, and RAM, are being driven by competition with AI data centers and threaten to increase consumer prices.
- Consumer price sensitivity is high, with many players likely to delay full-price purchases or shift to free-to-play titles if hardware costs rise.
CircanaFeb 2026
Report23 pages
U.S. Gamer Segmentation 2024 Edition
This analysis of the 2024 U.S. video gaming market identifies a resilient landscape where 71% of the population, or approximately 236.4 million people, engage with games. While this reflects a slight decline from the 74% peak seen in 2020, it remains significantly higher than the 67% recorded in 2018. The study utilizes a survey of 5,100 active gamers aged two and older, conducted between May and June 2024, to categorize the audience into six distinct behavioral segments: Super Gamers, Console Warriors, Transitionals, Easy Accessors, Daily Dabblers, and Incidental Players.
A primary finding is that while the total player count has dipped slightly, engagement and monetization are increasing. Gamers now spend an average of 14.5 hours per week playing, an increase of 1.8 hours since 2022. Spending has also risen to an average of $56.20 over a six-month period. Mobile remains the most pervasive platform, used by 65% of the total population, while console gaming has seen the most significant growth in weekly time investment. Conversely, PC gaming saw a 4% decline in reach since 2022.
The market is shifting toward more dedicated segments. There has been a notable decrease in casual "Incidental Players" and "Daily Dabblers," with a corresponding migration toward "Super Gamers" and "Transitionals." Super Gamers represent the most valuable demographic, typically consisting of males aged 18 to 34 who play across multiple platforms and engage deeply with gaming culture, including streaming and esports. Although teens and young adults remain the most valuable segments in terms of time and spend, the report notes that player investment is rising across nearly all age groups despite the overall contraction in the total number of gamers.
- The U.S. gaming population stands at 236.4 million people, representing 71% of the population, which is a slight decline from the 2020 peak of 74% but remains above 2018 levels.
- Average weekly engagement has increased to 14.5 hours, up 1.8 hours since 2022, while average spending over a six-month period has risen to $56.20.
- The market is shifting toward more dedicated segments, with a migration away from casual 'Incidental Players' and 'Daily Dabblers' toward 'Super Gamers' and 'Transitionals'.
- Mobile remains the dominant platform with 65% reach, while console gaming has experienced the most significant growth in weekly time investment.
- PC gaming reach has declined by 4% since 2022.
+1
CircanaAug 2024