Earnings
2 documents·15 charts & figures·0 verified statistics·2 publishers
Charts & Figures
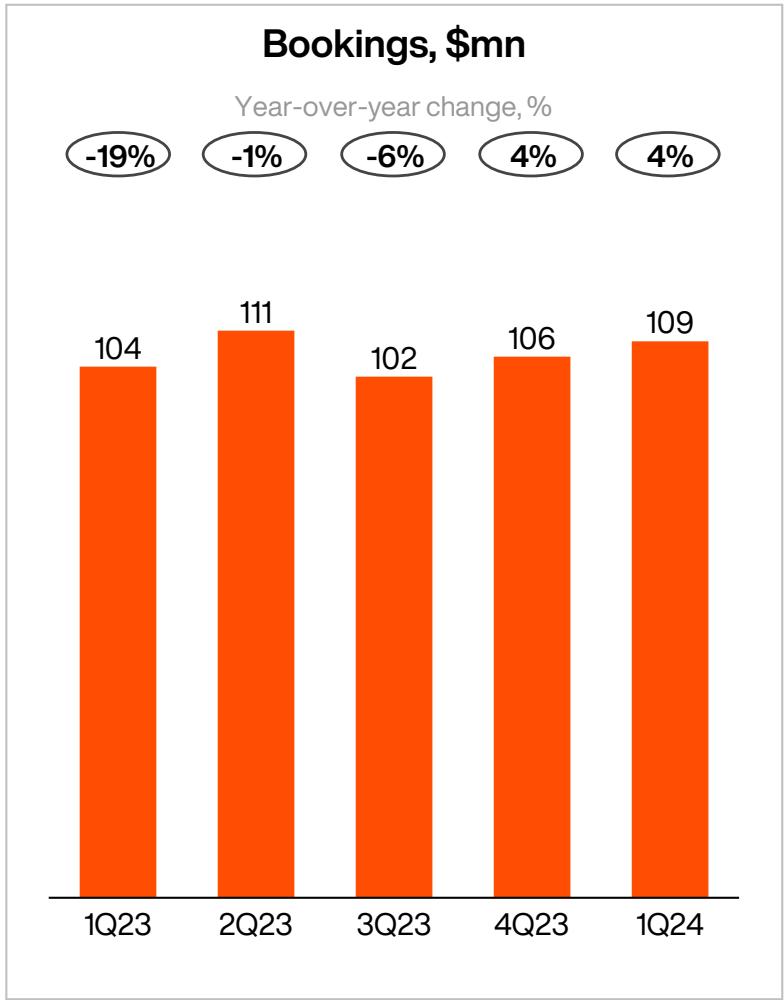
This bar chart from a game industry report illustrates "Bookings, $mn" across five quarters from 1Q23 to 1Q24, with each bar displaying the total booking value in millions. Additionally, it provides the year-over-year percentage change for bookings for each respective quarter, indicating growth or decline compared to the same quarter in the previous year.
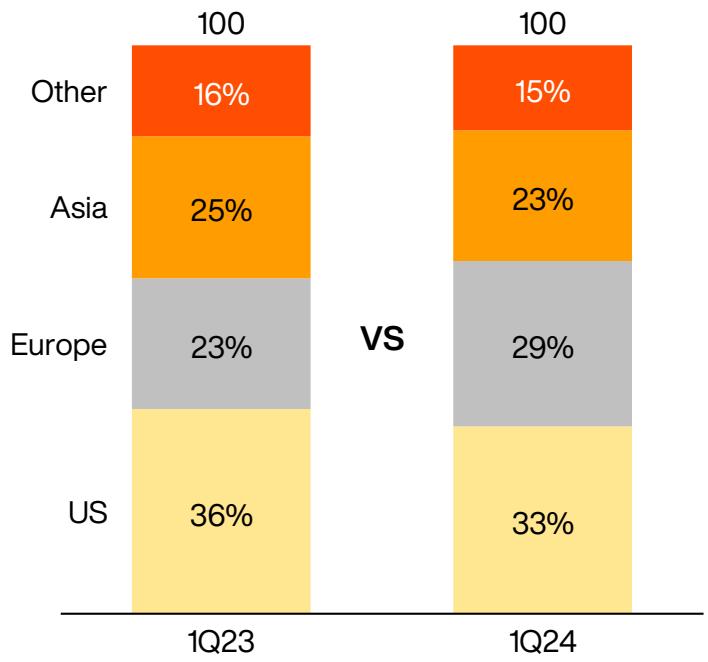
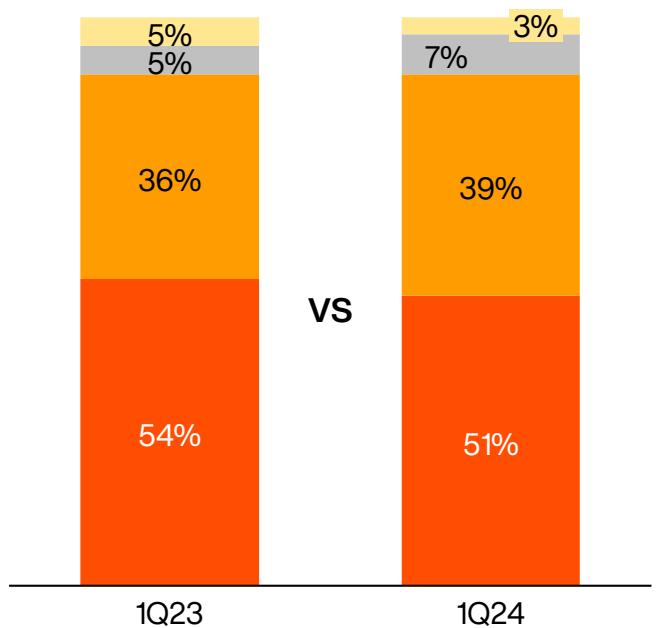
This image from a game industry report compares the regional distribution of a metric (likely revenue or market share, totaling 100%) between Q1 2023 and Q1 2024. It shows how the percentages for US, Europe, Asia, and Other regions have shifted year-over-year.
Diversification by geography, %
Revenue, $mn
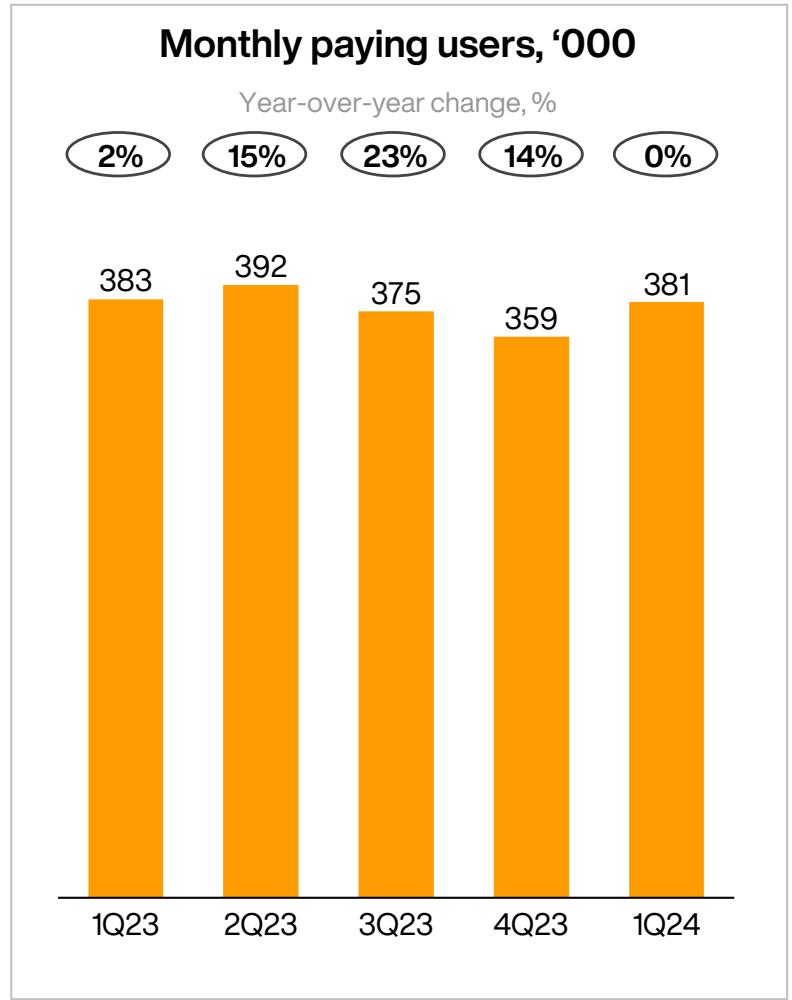
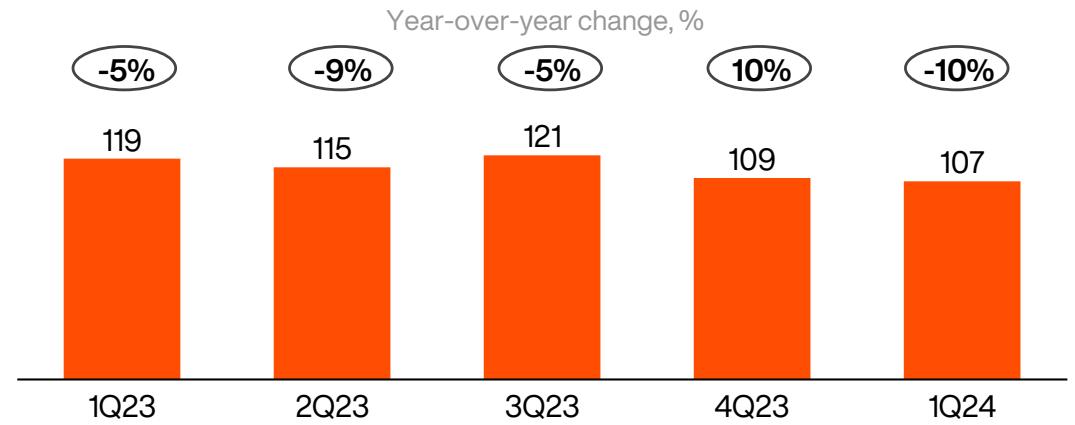
This image from a game industry report displays the "Monthly paying users, '000" over five quarters, from 1Q23 to 1Q24, showing the number of users for each quarter (e.g., 383k in 1Q23, 392k in 2Q23, etc.). Additionally, it presents the "Year-over-year change, %" for each quarter, indicating the percentage growth or decline in monthly paying users compared to the same quarter in the previous year.
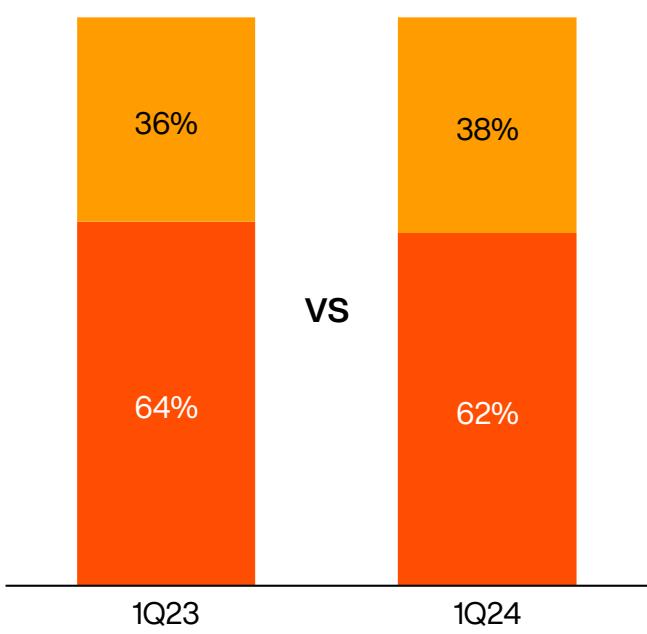
Diversification by platforms, %