Market (Mobile)·Updated Apr 30, 2026 by SocialPeta
What can I help with?
AI-powered answers with citations from the library.
What can I help with?
AI-powered answers with citations from the library.
Whitepaper · January 1, 2022
Published by SocialPeta
The 2022 global mobile gaming landscape underwent a significant transition toward quality and strategic refinement, characterized by a 2% decline in total advertisers and a 27.83% reduction in ad creatives during the first half of the year. This contraction in mature markets was offset by robust growth in emerging regions such as the Middle East, South America, and South Asia, where increasing smartphone penetration and young demographics present substantial expansion opportunities. The industry’s primary thesis centers on the necessity of localized, narrative-driven content and creative optimization to navigate a post-IDFA privacy environment that has increased advertising costs and shifted focus toward Android platforms. While casual, puzzle, and simulation genres dominate download volumes, RPGs and strategy titles remain the primary revenue drivers, commanding the highest advertising costs with average CPMs reaching $21.58. Video remains the dominant creative format, accounting for over 86% of all advertisements, as marketers increasingly leverage dramatic storytelling and influencer-led content to boost engagement. Despite the industry’s fascination with emerging technologies, consumer sentiment remains grounded; only 16% of players express interest in NFT-based gaming, whereas up to 39% show interest in metaverse-integrated experiences. Most users continue to prioritize mobile games as accessible tools for relaxation and time-killing. To sustain growth, publishers are pivoting toward programmatic channels, OEM integrations, and culturally relevant marketing strategies. Success in this competitive landscape requires a dual approach: maintaining high-frequency engagement through playable and video-based ads while simultaneously adapting to regional preferences, such as the demand for vernacular content in India or MOBA-focused titles in Southeast Asia. Ultimately, the market is moving away from broad-spectrum advertising toward highly targeted, immersive, and quality-focused campaigns that align with the core motivations of diverse global player bases.
III. As the COVID-19 pandemic continued, social games wer e going to boom: The pandemic that broke out in 2019 has changed the lives of people across the globe. The The pandemic that broke out in 2019 has changed the lives of people across the globe. The unpredictable variants and lockdowns have deepened the anxiety of people, resulting in their increased demand for online social services. Some social activities that were very popular offline have been Preface brought online, such as murder mystery games and social deduction games. The mobile version of [Among Us!] has been very popular among gamers ever since its release, with over 52 million downloads in the past half year. In the post-pandemic era, a boom of social games with simple downloads in the past half year. In the post-pandemic era, a boom of social games with simple What happened in the mobile game industry in the first half of 2022? As an answer to that, SocialPeta published its “H1 2022 Mobile Game Marketing White Paper”, providing global insights for you to enter global markets with your products. According to the global data captured and integrated by SocialPeta, 2022 saw the following trends in the mobile game market: I. Mobile mar keting focused on quality, leading to a dr op in total ads. But T2 and T3 mar kets exper ienced a significant incr ease: gameplays may come again. IV. With high-budget/high-quality mobile games in gener al, cr oss-platfor m play became the new gr owth point:
the mobile game market: I. Mobile mar keting focused on quality, leading to a dr op in total ads. But T2 and T3 mar kets exper ienced a significant incr ease: gameplays may come again. IV. With high-budget/high-quality mobile games in gener al, cr oss-platfor m play became the new gr owth point: More and more gamers have known the charm of high-quality games through live streams and short videos, resulting in a rising overall expectation for games and a surging demand for high-quality game contents. [Genshin Impact]'s success has proved the profitability of cross-platform games. With the H1 2022 saw a decline of 2% YoY in the number of advertisers and a decline of 27.83% in total technological innovation of cloud games and third-party game engines, cross-platform games may be creatives; but there were increases of over 10% YoY in advertisers in Middle East, South America, the mainstream in the future. creatives; but there were increases of over 10% YoY in advertisers in Middle East, South America South Asia, and other emerging markets. V. The booming E-spor ts mar ket boosted the global cultur al exchange: South Asia, and other emerging markets. V. The booming E-sports market boosted the global cultural exchange: II. Metaver se dr ove sever al technical innovations: According to the data released by Newzoo, the global game live-streaming audience has been growing II. Metaverse drove several technical innovations: According to the data released by Newzoo, the global game live-streaming audience has been growing The idea of metaverse had been a hot topic ever since it was first introduced. As the metaverse hype at an annual growth rate of about 10% since 2020.
I. Metaverse drove several technical innovations: According to the data released by Newzoo, the global game live-streaming audience has been growing The idea of metaverse had been a hot topic ever since it was first introduced. As the metaverse hype at an annual growth rate of about 10% since 2020. In addition to China, USA, Europe, South Korea and started to settle down, the market attitude became more rational. The effort to realize the real other mature esports regions, esports has been growing in popularity in Southeast Asia and India. There metaverse also brought the innovation of the related technologies. Tencent bought Black Shark were 8 large-scale and 10 small-scale esports projects in the Southeast Asian Games hosted in Vietnam Corporation this year, and transitioned its entire business from game phones to VR headsets, in May 2022. With the technological innovation as a result of metaverse, the esports market has utilizing it for laying a foundation for metaverse. Recently CMGE also launched Youyu Art, a become intensely competitive. distribution platform for digital artwork copyright. Overall, metaverse has developed from virtual The global mobile game market is ever-changing. So game companies need to pay constant attention to fantasy to firm reality. both the overall market trends and the marketing trends of top products of industrial segments.
About "SocialPeta" SociolPeto About “SocialPeta” SocialPeta, you can spy on your With With SocialPeta, you can spy on your competitors'ad data, and get ad data competitors' ad data, and get ad data from from networks, media, and advertisers around the world to inspire you. Category All MultiSelect Category Role-Playing Strategy Casino Role-Playing Puzzle Action Card Simulation Arcade Adventure Sports Board Racing Simulation Casual Family Casual Word Music Educational Get Inspiration Network Network From 1.2 Billion Ad Creatives Recommend Recommend Facebook Ads Google Ads Facebook Ads SocialPeta covers 72 countries and Global Networks Global Networks FB News Feed Instagram Audience Network Messenger regions, and over 90 well-known ad FB News Feed Google Ads(Admob) regions. and over ad YouTube YouTube Twitter UnityAds Vungle AppLovin AdColony Chartboost channels worldwide, such as Unity, AdColony Pinterest ironSource Yahoo! channels worldwide, such as Unity, reddit TikTok Mintegral (Mobvis... Twitter, YouTube, Facebook and reddit TopBuzz NEW Pangle(TikTok Aud... Snapchat Tapjoy AdSense Twitter, YouTube, Facebook and Snapchat m MoPub Korea Networks TikTok. We provide nearly 1 billion ad Korea Networks NAVER(4o() Daum(C18) Nate(L|o|) TikTok. We ad NVER(O) creatives, providenearly billion updating millions each day. Japan Networks Japan Networks Ameba(7-/5) Y Yahoo! Japan Gunosy(3-) Zucks SmartNews(-=. creatives. millionseach day. Ameba(7-/) S o c i a l P e t a i s t h e b e s t s o u r c e o f i-mobile AkaNe Nend AMoAd i-mobile SocialPeta is the best source of inspiration for ads. inspiration for ads.
ch day. Japan Networks Japan Networks Ameba(7-/5) Y Yahoo! Japan Gunosy(3-) Zucks SmartNews(-=. creatives. millionseach day. Ameba(7-/) S o c i a l P e t a i s t h e b e s t s o u r c e o f i-mobile AkaNe Nend AMoAd i-mobile SocialPeta is the best source of inspiration for ads. inspiration for ads. 3
Declaration SociolPeto 1. Data Sources 5. Concerned Regions With the assistance of the world's biggest advertising intelligence and analysis tool, SocialPeta Data Team has provided you with HK, Macao & TW: Hong Kong (China), Macao (China), Taiwan (China) insights into the mobile advertising data of global games. We collect advertising data by sampling worldwide, covering over 70 channels and nearly 70 countries and regions worldwide, and have captured a total of over 1.2 billion advertising data, with over 1 JP & ROK: Japan, South Korea million ad data being updated by the hour each day. Based on such huge data, we can gain insights into the advertising market trends. Southeast Asia: Thailand, Indonesia, Singapore, Malaysia, Vietnam, Philippines, Cambodia 1. Data Cycle and Indicators South Asia: India, Pakistan Overall date range of the report: Jan-Jun 2022 Middle East: Bahrain, Qatar, Saudi Arabia, UAE, Azerbaijan, Lebanon, Kuwait, Israel, For specific data indicators, please see the notes on each page. Egypt, Oman, Iraq, Morocco CIS: Russian Federation, Ukraine 1. Copyright Notice South America: Brazil, Chile, Argentina, Colombia, Peru, Venezuela, Paraguay
SocialPeta’s analytics platform aggregates data from more than 90,000 micro‑drama advertisers and 80 million ad creatives across over 55 countries, positioning itself as a key resource for launching and scaling micro‑drama apps worldwide. The platform projects the global micro‑drama market to reach $6 billion by 2026, emphasizing its capacity to deliver actionable insights into advertising strategies, creative formulas, and regional audience preferences. In 2025 the ecosystem expanded sharply: active advertisers rose by 63.6 % to over 700, while each advertiser produced a 144.9 % increase in creatives, largely thanks to AI‑powered production tools. Southeast Asia dominated genre preferences for “reversal of fortune” and “rebirth” dramas, whereas North America’s high‑paying users gravitated toward premium romance content. Europe remained the largest source of creative volume, underscoring a sustained upward trend in both advertiser participation and output across the globe. A case study of “Evil Bride vs. The CEO’s Secret Mom” illustrates high‑impact marketing: 44 K creatives generated an estimated 2.7 B impressions in key markets such as the USA, UK, Canada, Australia, and Germany. AI‑driven tools—DSV restructuring and automated cover/clip generation—reduced production time, enabling rapid localization. Short, cliffhanger‑style ads with intense conflict and strong visual hooks outperformed longer formats, driving downloads and engagement in North America, Southeast Asia, Latin America, and the Middle East. By late 2024 vertical micro‑dramas had matured into a stable ecosystem, with regional preferences—“reversal of fortune” in Southeast Asia and conflict‑driven stories in Latin America—fueling audience engagement. Production scaled to 55 vertical dramas in 2025 through standardized pipelines and AI‑enhanced marketing, allowing faster creative validation, lower volatility, and continuous data‑driven optimization. The analysis stresses that audience‑first IP development—testing concepts in short form before scaling—and multi‑platform, AI‑supported workflows are essential for reducing creative risk and converting IP into long‑term company capital.
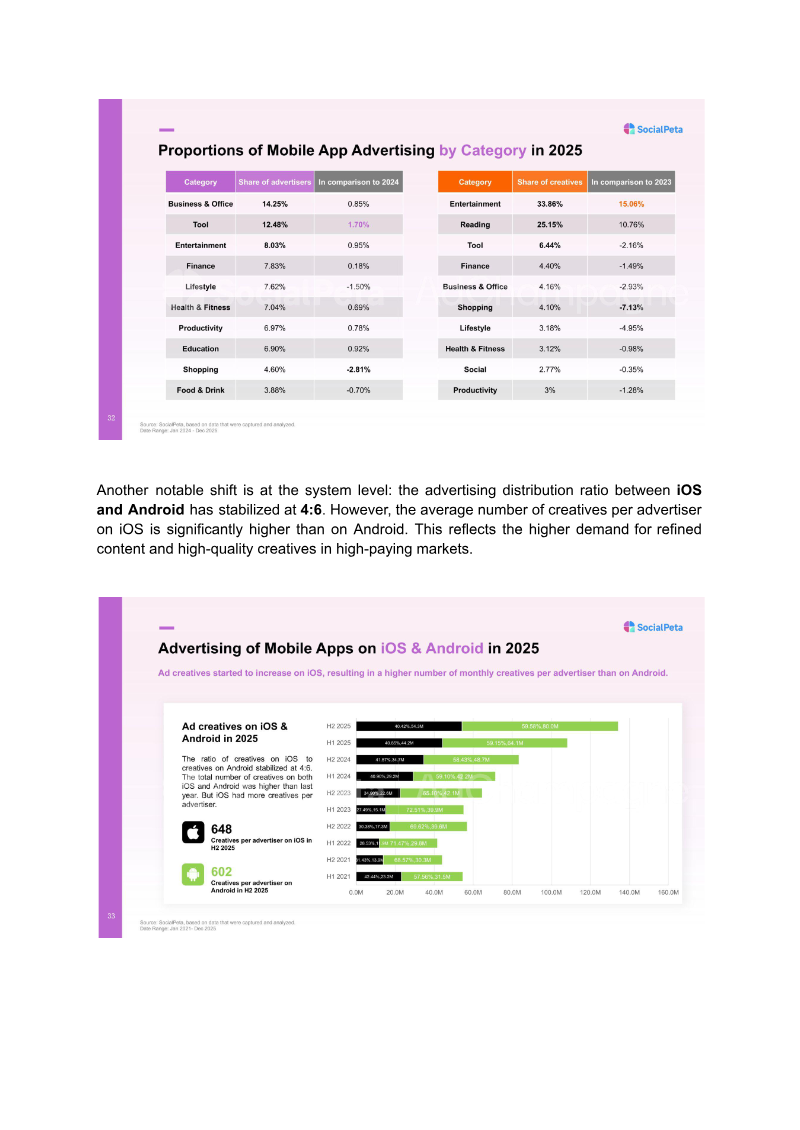
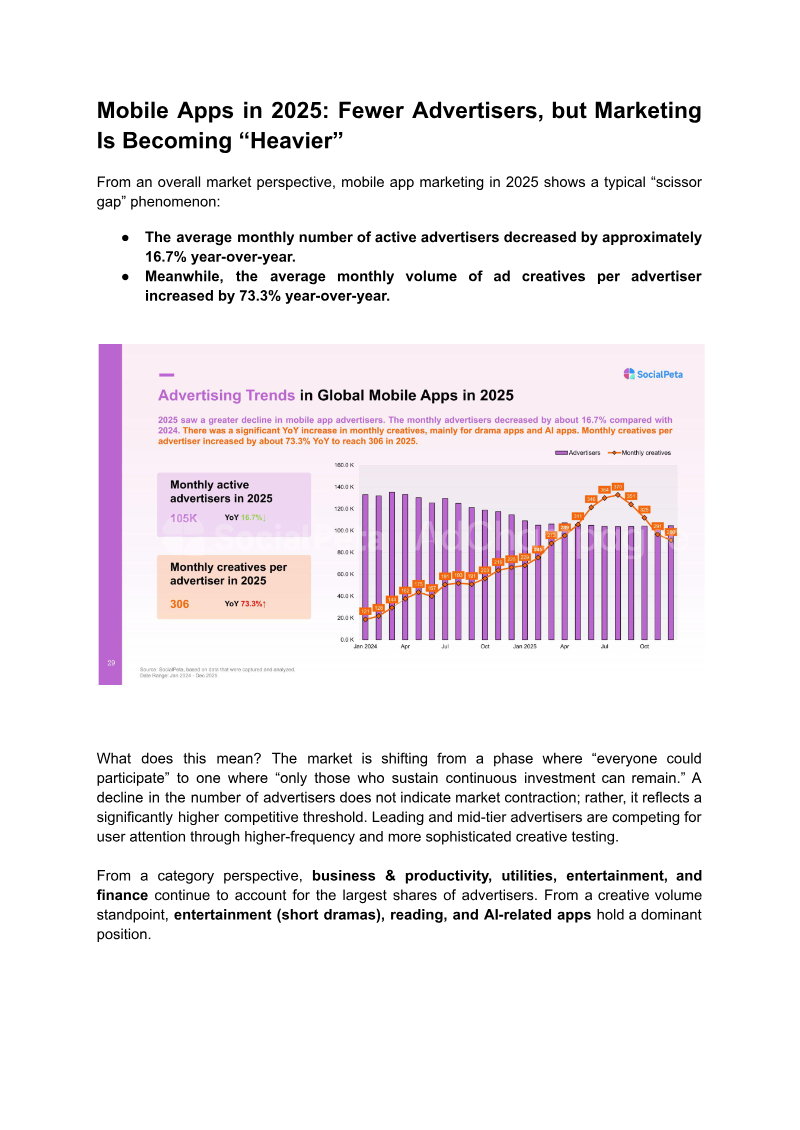
The white paper argues that the 2025 mobile app market has shifted from volume‑driven traffic growth to value‑centric, technology‑enabled optimization. It identifies a “scissor gap” where the number of active advertisers fell 16.7 % YoY while creatives per advertiser rose 73.3 %, indicating higher competitive thresholds and a focus on creative quality. Market share remains strongest in business & productivity, utilities, entertainment, and finance, but creative volume is dominated by short‑drama, reading, and AI apps. iOS and Android advertising ratios stabilized at 4:6, with iOS advertisers producing more creatives due to higher monetization expectations. User acquisition spend reached $78 billion, a 13 % YoY increase driven almost entirely by iOS, with e‑commerce, fintech, and betting leading non‑gaming verticals. Video remains the dominant ad format (≈70 % of social inventory), while static and playable ads serve testing, Android traffic, and engagement signals. AI has moved from a marketing tool to a core capability; leading AI apps scale through volume and quality, while many smaller entrants exit due to weak monetization. Finance apps maintain steady growth focused on user quality, lifetime value, and compliance, contrasting with AI’s rapid scaling. North America remains the most selective market, demanding high content quality and long‑term trust; success here signals scalability elsewhere. The paper concludes that sustainable growth now hinges on creative capability, system efficiency, AI integration, and long‑term value creation rather than sheer traffic volume.
The 2026 mobile marketing landscape is defined by a fundamental transition from media-centric targeting to creative-driven acquisition, necessitated by tightening privacy constraints and the saturation of traditional advertising channels. Competitive advantage now hinges on the speed of creative iteration and the ability to unify product development, monetization, and distribution. By leveraging early behavioral signals to predict long-term value, industry leaders are successfully aligning short-term performance metrics with sustainable user lifecycle growth. This evolution is supported by a strategic shift toward AI-powered personalization and behavior-driven gamification, as non-gaming applications increasingly adopt the engagement tactics traditionally reserved for the mobile gaming sector. Data from 2025 reveals a period of significant market consolidation, marked by a 16.7% decline in active advertisers alongside a 73.3% surge in creative output per advertiser. Playable ads have emerged as the premier format, consistently yielding the highest attention duration, scroll-stop rates, and conversion metrics. While the AI app sector experienced a sharp 48% contraction in the number of advertisers, top-tier players have responded by aggressively scaling localized marketing efforts. Simultaneously, the finance and health sectors have maintained greater stability, focusing on service-centric, medical-grade solutions and persuasive, value-based messaging to capture mature markets in North America and Europe. Global strategies for 2026 prioritize a balanced media mix, typically favoring video content, while emphasizing hyper-local operations in emerging regions like Southeast Asia and the Middle East. Success in these diverse markets requires intensive user education and culturally nuanced, scenario-based ad updates. As the industry moves toward subscription-based models and on-device AI integration, the focus has shifted from mere technological development to the large-scale monetization of AI-enhanced user experiences. Ultimately, the market is moving toward a future of highly segmented, interactive, and performance-driven advertising that prioritizes technical precision and regulatory compliance to foster long-term user trust.
The analysis demonstrates that while the global pool of active AI‑advertisers has contracted by 35–45 % in H1 2025, the remaining players are compensating with a markedly higher creative output—an 84 % increase to an average of 416 monthly creatives per advertiser. Video advertising dominates the landscape, with 84 % of all ads and more than half of inventory in 15‑30 second formats. Geographic patterns reveal that Europe and North America maintain the largest advertiser volumes, yet exhibit lower creative density than Japan and South Korea, which show the fastest growth rates. Market saturation appears to be driving these firms toward intensified brand exposure through increased creative frequency, even as overall advertiser participation declines. Meitu’s financial results corroborate the commercial potency of AI‑driven features. Revenue rose 12.3 % to RMB 1.8 billion, largely propelled by a 45.2 % jump in AI‑powered imaging and design subscriptions to RMB 1.35 billion, while advertising income grew modestly by 5 %. The company’s flagship AI applications—“AI Wardrobe,” “WHEE,” and “Wink”—secured top positions in App Store charts across more than twelve countries, underscoring the role of AI enhancements in global user acquisition and subscription monetization. The broader ecosystem of AI‑powered mobile apps, including chatbots, development tools, and educational platforms, continues to enjoy strong monthly active user figures and high stickiness. However, product overlap creates fierce competition, making clear positioning and precise subscription pricing essential for successful global expansion. Rapid overseas success is achievable when apps tailor local marketing strategies to regional preferences. These conclusions are drawn from SocialPeta’s extensive dataset of 1.6 billion advertising data points, sampled across 80+ channels and regions from January 2024 to June 2025.