FinancialKLab
Financial Results for the Second Quarter of the Fiscal Year Ending March 31, 2020
9 pages~13 min full read
Key insights
7 takeaways · ~3 min read- 01
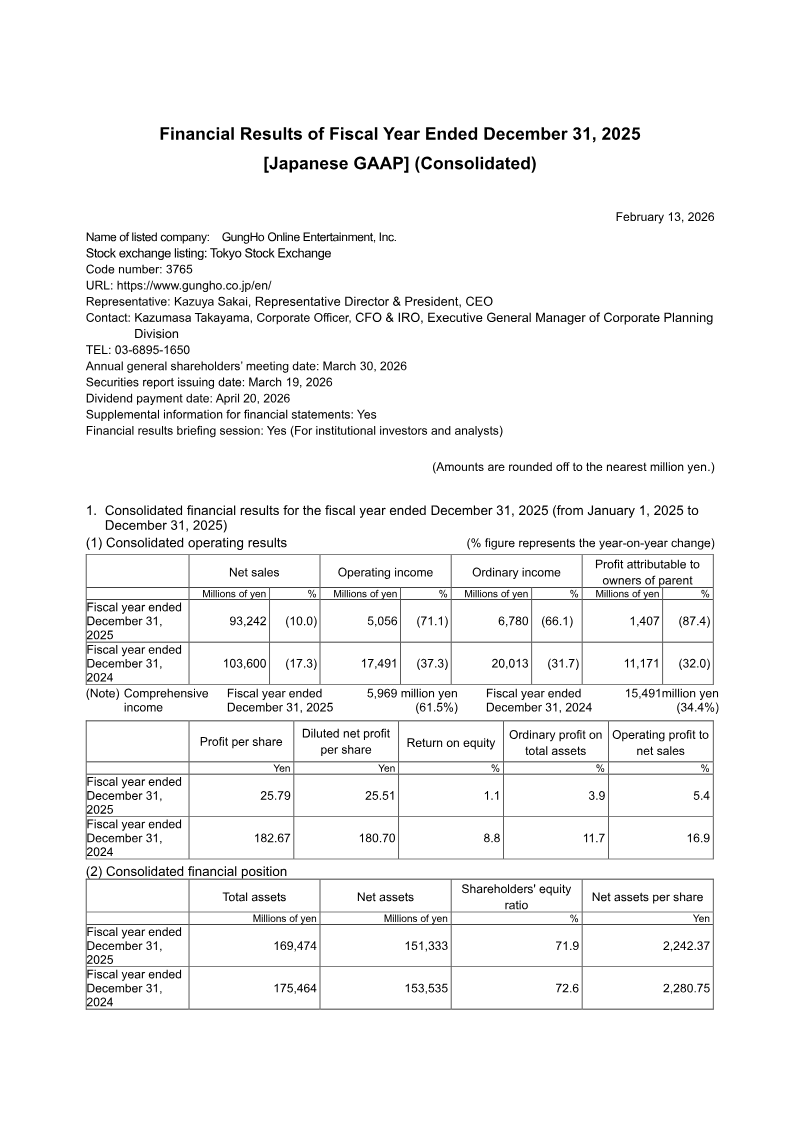
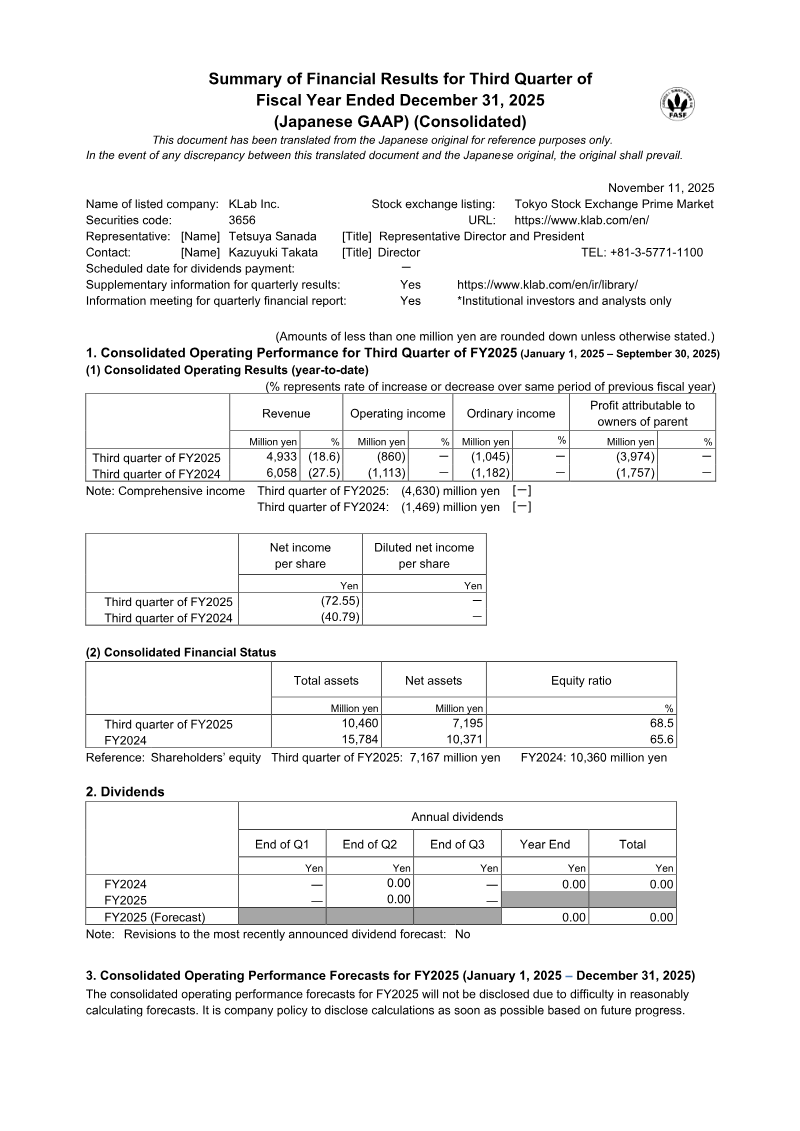
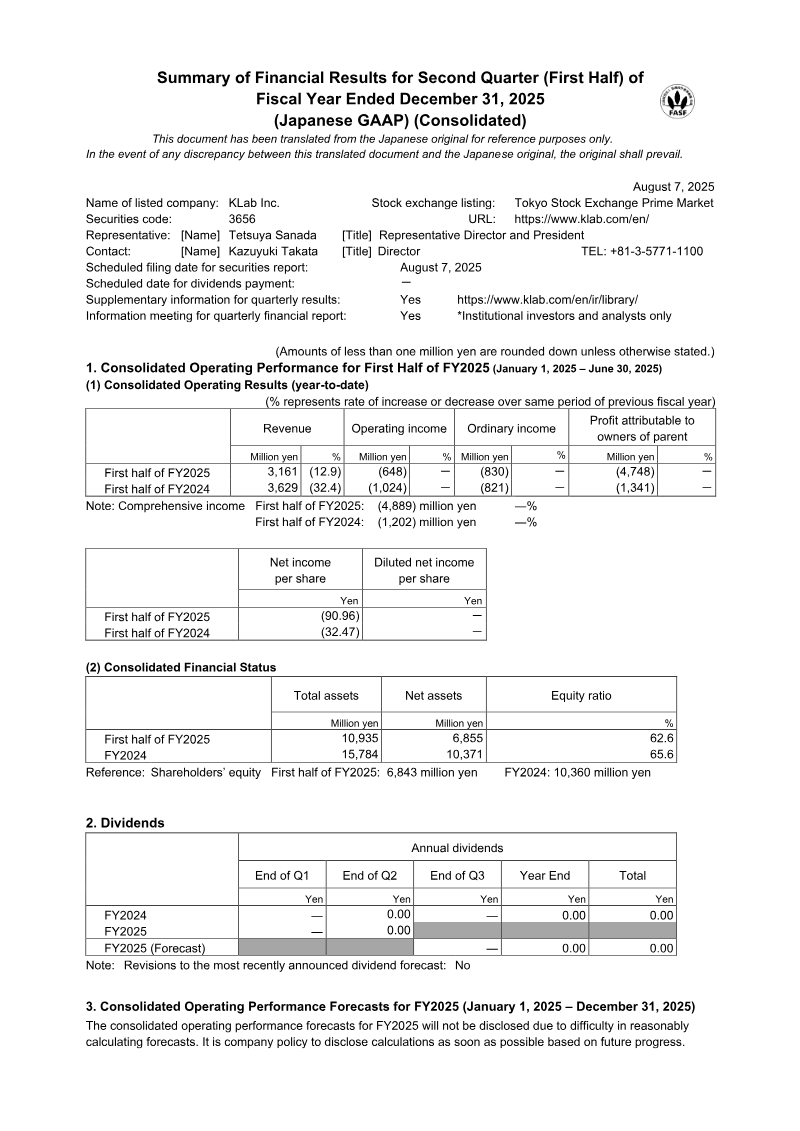
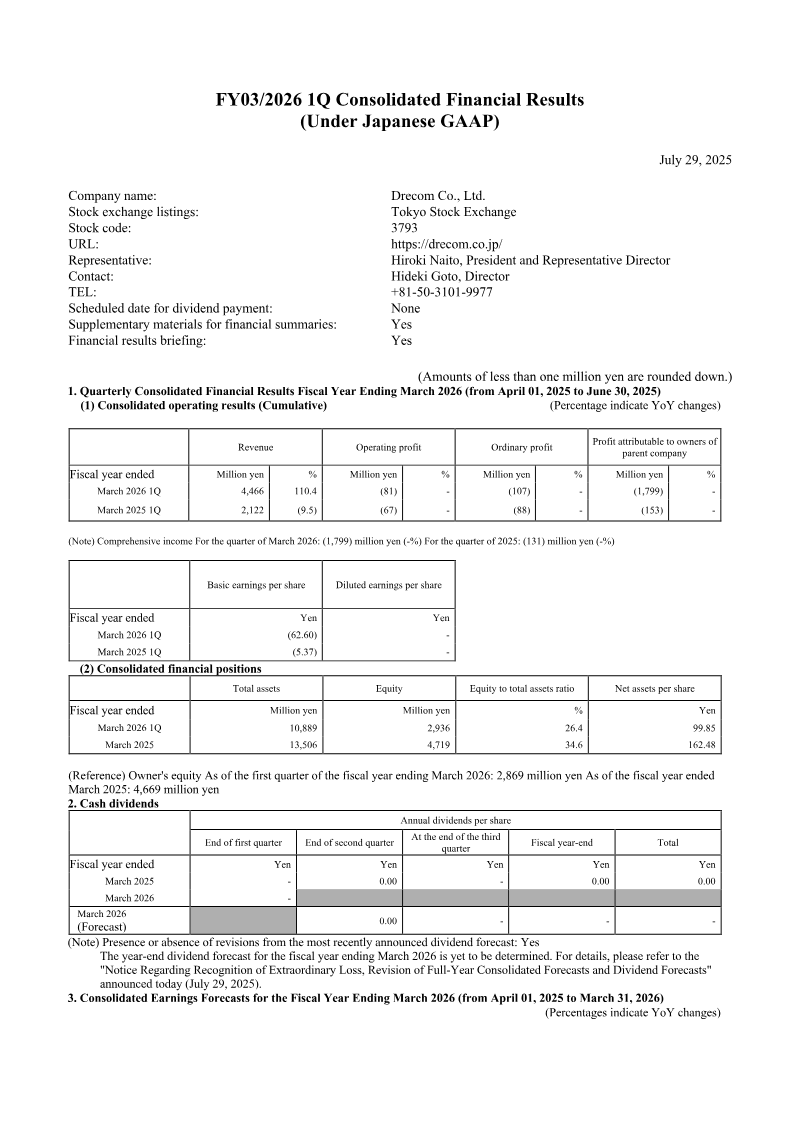
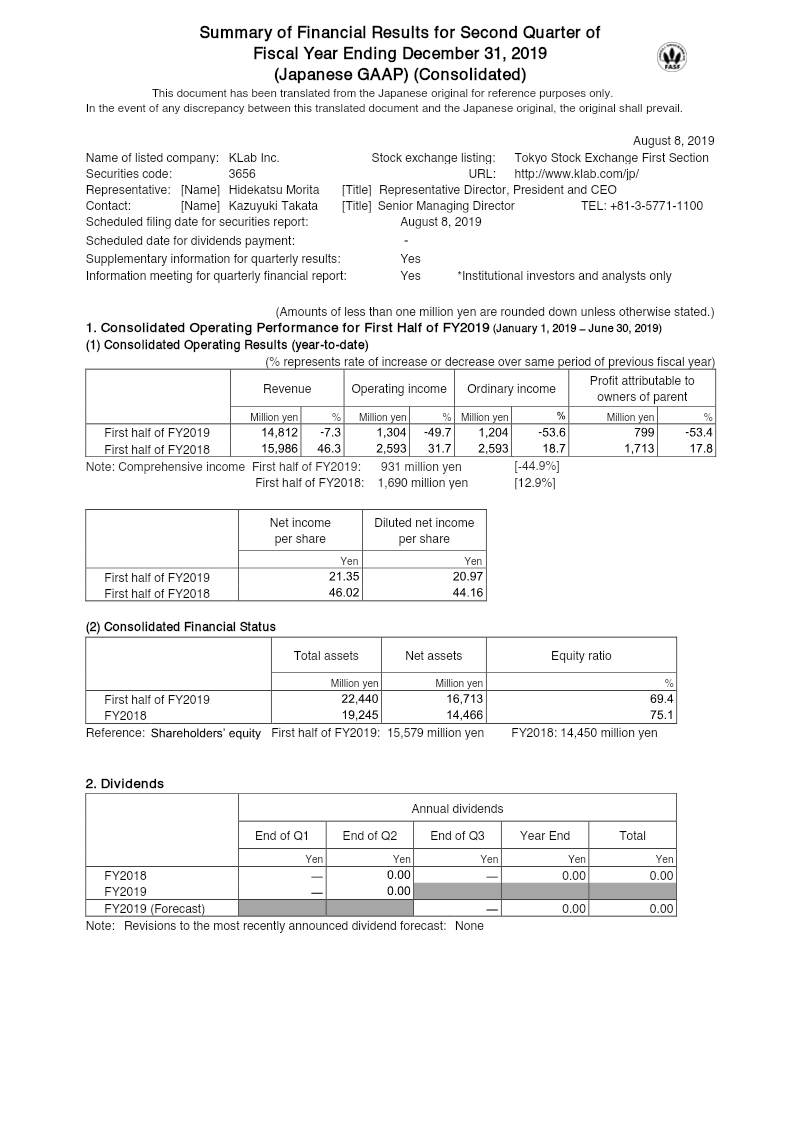
KLab Inc. reported a significant decline in profitability for the first half of 2019, with operating income falling 49.7% to ¥1,305 million and profit attributable to owners of the parent dropping 53.4% to ¥799 million.
See it on page 1 - 02
Revenue for the period decreased by 7.3% to ¥14,812 million, as the revenue decline from the 'Love Live! School Idol Festival' franchise outweighed the growth generated by 'Magatsu Wahrheit'.
See it on page 4 - 03
Total assets grew by ¥3.19 billion to reach ¥22.44 billion, primarily driven by increases in accounts receivable and software assets.
See it on page 4 - 04
Total liabilities rose by ¥948 million to ¥5.73 billion, a shift largely attributed to an increase in long-term debt.
See it on page 4 - 05
The company's equity ratio decreased from 75.1% in FY2018 to 69.4% for the first half of FY2019.
See it on page 1 - 06
KLab Inc. opted not to issue a dividend for the first half of 2019.
See it on page 1 - 07
The company revised its FY2019 forecast upward for revenue, while projecting operating income to fall within the range of ¥450 million to ¥1,000 million.
See it on page 4